

Fundamentalists and technical analysts have been at odds with each other for more than 100 years. Part of the reason is the continuing myth that technical analysis is a means of predicting price action—it is not. During the early years of the Dow theory, which is one of the original foundations of technical analysis, “random walk” theorists discarded Dow theory entirely.
Later, as cycle theories about the stock market emerged during the 1930s, the goal was to prove that the stock market actually did have cycles. These early theorists attempted to predict the stock market trend and direction over extended periods of time.
Most of those predictions failed dismally, just as most predictions about the stock market today do not predict accurately. This fortifies the assumption of fundamentalists that technical analysis is worthless, a bogus school of thought that has no value to professional fundamentalists.
Technical analysis should not be used as a predictive tool; rather, its worth and value comes from the relational analysis it has provided that extrapolates fundamentals into a graphical form. This can provide more understanding and insights into the price action of both short- and long-term trends, enabling fundamentalists to confirm their quantitative fundamental interpretations with the reactionary response of price to those fundamentals.
The market now comprises nine distinctly different market participant groups, each trading and investing with their own unique agenda, tools, venues, fundamental data access, process for transactions, and the business of portfolio management and trade management.
When technical analysis is viewed as a graphical representation of the market participant cycle and fundamentals of a company, the patterns become relevant even to fundamentalists who have never used technical analysis.
Professional funds managers can see aspects of how the leadership of the market, which generally is represented by the giant buy-side and sell-side institutions, has interpreted and responded to the fundamentals in chart format. Confirmation of the expected reaction to fundamentals, financial reports, and earnings reports is also clearly reflected in price and trend.
As an example, the accompanying chart of the S&P 500 shows the response and reaction of the major institutions to the past two earnings seasons.
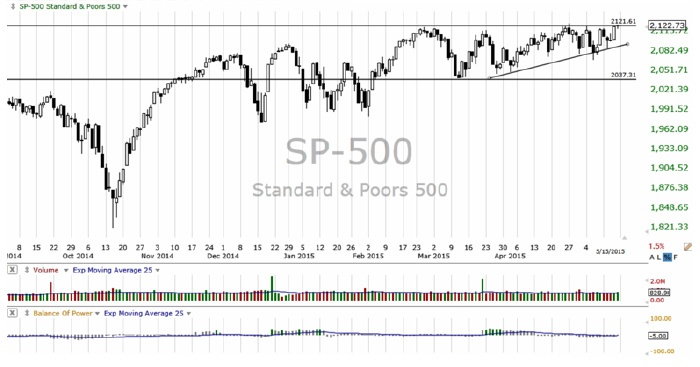
In December, the chart shows volatile value action, yet lows that hold and remain stable. Fundamentalists know that the earnings picture started to decline at that time, oil commodity prices were plummeting, and that prices for most S&P 500 stocks had exceeded underlying value.
The most recent Q1 earnings season in 2015 shows a sideways pattern this spring as giant funds quietly rotated to lower their held positions and many smaller-lot investors were convinced to “buy on the dip.” The recent higher lows within the sideways pattern confirm that redemption demands are very low, that smaller funds are buying, and that money is continuing to flow into the S&P 500.
Technical patterns reveal how different market participant groups react to earnings seasons. This can be invaluable information for the professional investor.
The opinions expressed in this article are those of the author and do not necessarily represent the views of Proactive Advisor Magazine. These opinions are presented for educational purposes only.
 Martha Stokes, CMT, is the co-founder and CEO of TechniTrader and a former buy-side technical analyst. Since 1998, she has developed over 40 TechniTrader stock and option courses. She specializes in relational analysis for stocks and options, as well as market condition analysis. An industry speaker and writer, Ms. Stokes is a member of the CMT Association and earned the Chartered Market Technician designation with her thesis, "Cycle Evolution Theory." www.technitrader.com