The first quarter was difficult for stocks. Investors faced the Iran war, a surge in oil prices, rising Treasury yields, and a sharp reassessment of how much help they could expect from the Federal Reserve.
By quarter-end, the S&P 500 had posted its worst quarter since 2022 as inflation fears intensified, megacap technology shares pulled back, and markets grew less confident that rate cuts were coming soon.
While some economic data was positive, several factors deepened investor anxiety. Consumer sentiment fell as the conflict pushed gasoline prices higher, and the consumer price index rose 0.9% in March and 3.3% from a year earlier. That reinforced the sense that inflation remained stubborn just as growth expectations were becoming less certain.
The mood shifted last week as markets began to price in a possible diplomatic off-ramp. Optimism around U.S.-Iran negotiations and broader Middle East de-escalation helped fuel a relief rally in risk assets. That turn was amplified by a sharp drop in crude prices after Iran said the Strait of Hormuz would remain open to commercial shipping during the ceasefire period. That eased fears of a prolonged energy shock and gave investors reason to believe the worst of the quarter’s panic might be fading. The start of what looks to be a strong earnings season provided further reassurance for market bulls.
Overview of Q1 2026
Morningstar provided these key takeaways on U.S. market performance in the first quarter:
- “The broad stock market fell in the first quarter, but the overall decline masks gains in select sectors.
- “Losses were led by technology and communication services stocks, with overall indexes down, owing to their heavy weightings in the market.
- “Investors rotated into stocks that had been lagging in recent years, notably value stocks, small-caps, and dividend payers.”
Morningstar added in its review,
“The stock market may have started the year posting losses, but it was far from a sea of red. The reason: Investors shifted into previously unloved corners even as they sold the former big winners. As a result, amid the uncertainty of the Iran war and concerns about artificial intelligence’s impact across a wide range of industries, stocks in the basic materials, industrials, and consumer defensive sectors finished the first quarter with gains. Most of all, energy stocks staged a huge rally on the back of the surge in oil prices. …
“Meanwhile, value stocks bested growth. In addition, small-company stocks fared better than those for larger companies, and dividend payers outperformed. The rotation has been driven by a combination of fundamental concerns—AI undercutting revenue and business models, the war-driven spike in oil—as well as stretched valuations on the stocks that had been leading the rally, according to Dominic Pappalardo, chief multi-asset strategist for Morningstar Wealth.”
FIGURE 1: U.S. STOCK MARKET PERFORMANCE (Q1 2026)

Source: Morningstar. Data as of 3/31/2026. Performance shown in USD.
![]() Related Article: Active ‘stock picking’ or passive market exposure?
Related Article: Active ‘stock picking’ or passive market exposure?
Massive relief rally defines early to mid-April
Strategist Charlie Bilello of Creative Planning provided the following insights last Friday, April 17:
“The old saying in markets ‘stairs up, elevator down’ has been flipped on its head this year.
“It took the S&P 500 over two months from its peak in January to fall 10% and less than three weeks to surge back to new all-time highs with a vertical rally of 13%.
“Today the index crossed above 7,100 for the first time.”
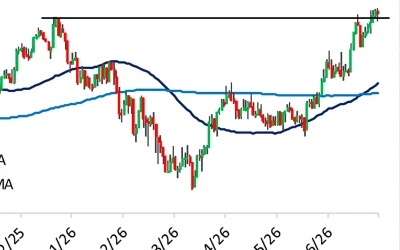
FIGURE 2: REMARKABLE APRIL TURNAROUND FOR THE BROAD MARKET

Source: Charlie Bilello, Creative Planning. YCharts data through 11:13 a.m. EDT, 4/17/2026.
Bilello also pointed to rising expectations that the war in Iran was effectively over and traffic in the Strait of Hormuz would return to normal:
FIGURE 3: CONSUMER DISCRETIONARY AND ENERGY SECTORS REVERSE DIRECTION

Source: Charlie Bilello, Creative Planning. YCharts data through 12:36 p.m. EDT, 4/17/2026.
What will drive markets in the short term?
Clearly, the on-again, off-again status of the U.S.-Iran ceasefire and peace negotiations—and the status of shipping lanes in the Strait of Hormuz—are top of mind for traders.
After a rough weekend for the fragile ceasefire, the market’s reaction on the morning of Monday, April 20, was telling. Oil prices rose, but an anticipated large drop in U.S. equity markets did not materialize. While that could change quickly, the muted market response seemed to reinforce comments from respected strategist Ed Yardeni:
“Last week, we wrote that the financial markets may be learning to live with the war in the Middle East, much as they learned to live with the war between Ukraine and Russia. We will get a test of that notion on Monday, given that crude oil prices are up around $5 a barrel this evening amid renewed tensions in the Strait of Hormuz.
“The S&P 500 is up 12.3% to a new record high over the past three weeks since it bottomed on March 30. The leader board reads like a risk-on checklist. … This is a broad melt-up. For now, animal spirits are back in the stock market. …
“We called the bottom after the strong close on March 31, and now our 7,700 target for the S&P 500 looks achievable by the end of this year, if not sooner.”
One of the chief reasons for Yardeni’s optimism is “the resilient earnings fundamentals which are powering this bull market.”
Recent commentary at The Wealth Advisor agrees with this assessment:
“Wall Street strategists are entering the current earnings season with a constructive outlook, anticipating a robust quarter of corporate profit growth. Despite persistent inflationary pressures and ongoing geopolitical uncertainty, U.S. companies continue to demonstrate resilience, translating into solid financial performance across key sectors.
“Early results from large financial institutions have set a positive tone, reinforcing expectations for approximately 12% year-over-year earnings growth for the S&P 500. This strength reflects not only favorable operating conditions but also disciplined cost management and sustained demand across broad segments of the economy. For wealth advisors and RIAs, the takeaway is clear: corporate fundamentals remain supportive of equity market stability, even as macro risks linger.
“Earnings per share trends further underscore this momentum. Consensus projections indicate a meaningful expansion. …”
FIGURE 4: BOTTOM-UP EPS ESTIMATES—CURRENT & HISTORICAL

Source: FactSet
RECENT POSTS