


With the calendar moving from October to November, the U.S. equity market has entered its “Best Six Months,” a typically bullish seasonal period.
The “Best Six Months” tendency was first published by Yale Hirsch, founder of the Stock Trader’s Almanac, in 1986. The concept behind the “Best Six Months” is simple. Hirsch’s research suggests that over the last several decades the market has made a massive portion of its gains between November and April. And during the remaining six months, it has generally struggled to make headway. Since this market seasonality tendency was first discovered, the edge has persisted, with the “Best Six Months” continuing to outperform the “Worst Six Months.”
Additionally, the market just shifted into the third year of the presidential cycle. At Quantifiable Edges, I measure the presidential cycle years from November–October rather than January–December. That allows the cycle years to better match up with the actual elections, which take place in early November. And while elections are always during the first week of November, I always start measurement of the cycle year on November 1. This makes for easy evaluation when combining it with the “Best Six Months” cycles. In general, the third year of the presidential cycle has been a strong one.
When the “Best Six Months” and the third year of the presidential cycle have been active at the same time, the results since 1960 have been outstanding. In Table 1, each instance of the two tendencies occurring at the same time has been analyzed. In each case, the analysis shows how an investor would have fared buying a proxy for the S&P 500 at the close on Oct. 31 and selling the investment at the close on April 30.
TABLE 1: S&P 500 TRADING PERFORMANCE NOVEMBER–APRIL
In the third year of the presidential cycle (1960–2017)
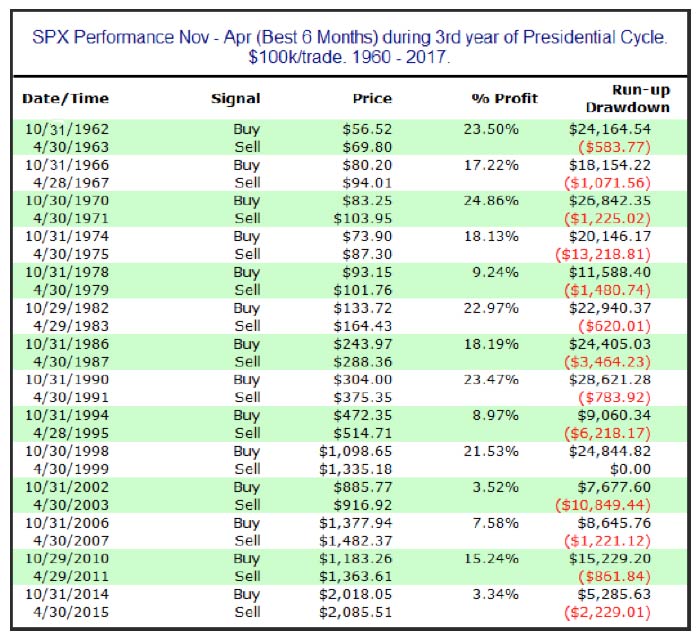
Note: Uses assumption of $100,000 invested. The S&P 500 Index (SPX) cannot be directly purchased, and the analysis assumes the use of investment vehicles that track the Index.
Source: Quantifiable Edges
All 14 instances since 1960 have shown gains. Of course, there have been drawdowns along the way. The 1974–1975 period saw SPX pull back 13.2% from its October closing price before rebounding and finishing April 18.1% above the October closing price. And in 2002–2003 there was a 10.9% drawdown from the October close before finishing April 3.5% above it. But overall, the statistics have been incredibly lopsided. The average six-month period saw a net gain of 15.5%. The average run-up (from the October close) was 17.7% and the average drawdown just 3.1%. Long-term market seasonality does not get any better. Traders may want to keep this in mind when establishing their current market bias.
The opinions expressed in this article are those of the author and do not necessarily represent the views of Proactive Advisor Magazine. These opinions are presented for educational purposes only.
 Rob Hanna has worked in the investment industry since 2001. He is the founder and publisher of Quantifiable Edges, a quant-based website where he also publishes a newsletter. After managing a private investment fund through Hanna Capital Management LLC from 2001 to 2019, Rob joined Capital Advisors 360, where he now serves as a registered investment advisor and focuses on short-term and quantitative strategies. QuantifiableEdges.com
Recent Posts: