Should leveraged ETFs be considered for long-term holdings?
Should leveraged ETFs be considered for long-term holdings?

QQQ, which tracks NASDAQ 100 stocks, has led the bull market in 2023–2024 as technology stocks have done especially well. QQQ is up more than 67% over the last 16 months and started making new all-time highs again in December 2023. TQQQ is the most popular 3X leveraged version of QQQ. It has risen a whopping 258% since the end of 2022, but it would still need to rise another 42% to pass the highs from November 2021. This can be seen in the monthly chart in Figure 1.
FIGURE 1: QQQ AND TQQQ RECENT TRENDS

Sources: Quantifiable Edges, market data
That is some severe underperformance versus QQQ since the 2021 top.
So what gives?
It is mostly just a math issue. Leveraged ETFs such as TQQQ use daily leverage. With a 3X leveraged ETF, a 2.5% up day for QQQ would be about a 7.5% up day for TQQQ—and a 2.5% down day for QQQ would be about a 7.5% down day for TQQQ. When the market gets volatile and choppy, the swings back and forth will hurt TQQQ more than QQQ.
Let’s look at a simple example: QQQ goes down 2.5% two days in a row and then bounces back 2.5% two days in a row. These are fairly large one-day moves, but they demonstrate the point nicely. Table 1 shows hypothetical daily changes for QQQ and TQQQ and the value of each holding over the period.
TABLE 1: COMPARISON OF QQQ AND TQQQ PERFORMANCE

Source: Quantifiable Edges
![]() Related Article: NASDAQ/SPX relative strength is a powerful indicator
Related Article: NASDAQ/SPX relative strength is a powerful indicator
In just the short period shown above, the choppy action would have resulted in TQQQ lagging by about 1%. So when QQQ suffered a 37% drawdown from its November 2021 high, TQQQ was hit with a drawdown of over 82%. To get back to even from there, TQQQ would need to make back over 450%. And as we saw in Figure 1, it still has quite a way to go.
You might not yet be convinced of the danger of holding TQQQ over the long term. After all, that long-term chart is still showing massive gains over the last 13 years or so. In fact, TQQQ opened on Feb. 11, 2010, with a dividend and split adjusted price of $0.42. Its current return since inception is 14,329%. That blows away the 1,055% return of QQQ over the same period.
But perhaps TQQQ’s inception date was just exceptionally good timing. What would happen if TQQQ started on the same day as QQQ?
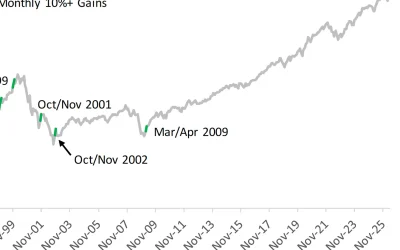
To answer this, I created a TQQQ substitute security (TQQQx) with data going back to the QQQ inception date (March 10, 1999). I calculated 3X returns each day. Figure 2 is a hypothetical (log-scaled) price chart for TQQQx.
FIGURE 2: HYPOTHETICAL PERFORMANCE OF A 3X QQQ ETF FROM 3/10/1999

Source: Quantifiable Edges
The current price of $3,727 means it is still in a 53% drawdown from the high of March 2000. TQQQx would need to see a rally of 114% to make a new all-time high. The drawdown from March 2000 to March 2009 was enormous. The trip from a high of $7,961 to a low of $3.47 equates to a 99.96% decline. Anyone holding would basically have been completely wiped out—especially if they needed to make withdrawals.
I will also note that my calculation is overly generous because it does not account for management fees. In other words, the numbers are too optimistic, and the reality of the drawdown would have been even worse than I show.
I have encountered several people that made a fortune over the last 10 to 13 years simply by holding onto a sizable position in TQQQ. But as we see above, leverage can make fortunes, and it can also destroy them—as evidenced by the decade from 2000 to 2009. Leveraged ETFs should be used with great caution.
Even the fund originators warn that the leveraged ETFs “are not designed to track their respective underlying indices over a period of time longer than one day.” You can see that in the preceding charts.
If you use leveraged ETFs, you need an exit plan. You don’t want to ride out an 82% drawdown at any age … and you especially don’t want a 99.6% drawdown. Buyer (and holder) beware.
The opinions expressed in this article are those of the author and the sources cited and do not necessarily represent the views of Proactive Advisor Magazine. This material is presented for educational purposes only.
 Rob Hanna has worked in the investment industry since 2001. He is the founder and publisher of Quantifiable Edges, a quant-based website where he also publishes a newsletter. After managing a private investment fund through Hanna Capital Management LLC from 2001 to 2019, Rob joined Capital Advisors 360, where he now serves as a registered investment advisor and focuses on short-term and quantitative strategies. QuantifiableEdges.com
RECENT POSTS

‘Optimized Outcomes’ explains core principles for creating and preserving wealth

Behavioral biases: Not just for investors

What does market history say about ‘Sell in May’?

Retiring boomers broke this important economic relationship