The Bureau of Labor Statistics employment report was greeted by many Wall Street analysts with surprise—and an equally surprising market rally on Friday, April 5.
CNN summarized the jobs release data as follows:
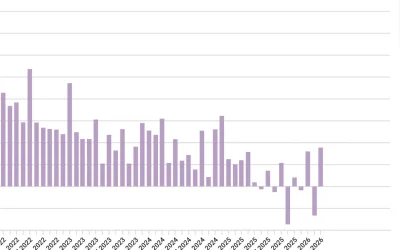
- “The latest jobs report came in hotter than expected, showing that the US economy added 303,000 jobs last month and the unemployment rate fell to 3.8%, according to Friday data from the Labor Department.
- “The headline number far surpasses expectations for 205,000 job gains, and underscores the ongoing resilience of the US labor market.
- “That didn’t stop markets from rallying Friday, with the Dow ending the day up by more than 300 points despite the implications for higher interest rates.
- “Economists had expected the March jobs report to show a strong but slowing job market, with lower month-on-month growth and a steady uptick in joblessness.
- “The latest employment snapshot comes after 11 rate hikes from the Federal Reserve in its battle to rein in inflation.
- “Friday’s data likely underscores for the central bank the importance of patience before starting to cut rates to keep the economy in a ‘Goldilocks’ state that is neither so hot that it increases inflation nor so cold that it triggers a recession.”
FIGURE 1: U.S. NONFARM PAYROLLS—ONE-YEAR TREND

Sources: Trading Economics, U.S. Bureau of Labor Statistics
In an alternative point of view, First Trust’s analysis of the March jobs report agrees that the topline data was strong, especially for the labor participation rate, but also states that “not all the news was quite as good”:
“We like to follow payrolls excluding government (because it’s not the private sector), education & health services (because it rises for structural and demographic reasons, and usually doesn’t decline even in recession years), and leisure & hospitality (which is still recovering from COVID Lockdowns). That ‘core’ measure of payrolls rose a more modest 95,000 in March and is up only 61,000 per month in the past year. Also, the household survey shows full-time employment down in the past year, which usually only happens in and around recessions. In addition, given the strength in headline overall payrolls, the Fed has to question whether monetary policy is really tight, given also that CPI inflation remains stubbornly above 3.0%. As a result, the Fed could stay higher for longer, which could hurt more when the effects of tighter money eventually bite.”
(Editor’s note: The CPI release on April 10 added further support to First Trust’s commentary, with CPI rising 3.5% in March. CNBC noted this will likely be “dashing hopes that the Federal Reserve will be able to cut interest rates anytime soon.”)
Improving economic data?
Along with the consistently stronger-than-expected employment situation in the U.S., Bloomberg recently pointed to two key measures of the economy showing a consistently positive tone through the end of 2023:
“The government’s two main measures of US economic activity posted strong advances at the end of last year, pointing to an economy that’s still expanding at a healthy clip.
“Gross domestic product rose at an upwardly revised 3.4% annualized pace in the fourth quarter on the back of stronger household demand and business investment, according to the third estimate of the figures from the Bureau of Economic Analysis out Thursday.
“The government’s other main gauge of economic activity—gross domestic income—rose 4.8%, the most in two years. GDI measures income generated and costs incurred from producing goods and services, whereas GDP measures spending on such goods and services.”
However, Bloomberg also notes, “In theory the two indicators should be equal, but over the last several quarters an unusually large gap had opened up between them, with GDP increasingly outrunning GDI. The discrepancy raised questions about the underlying pace of economic expansion.”
FIGURE 2: KEY GAUGES OF U.S. ECONOMIC ACTIVITY EXPAND AT FIRM PACE

Sources: Bloomberg, Bureau of Economic Analysis
![]() Related Article: Analysts raise SPX estimates amid broad market risks
Related Article: Analysts raise SPX estimates amid broad market risks
In more recent data, First Trust reports, “The ISM Manufacturing Index showed some signs of life in March, rising to 50.3, and beating even the most optimistic forecast from any economics group surveyed by Bloomberg. The reading above 50 signals that activity in the US manufacturing sector expanded in March (albeit barely), snapping sixteen consecutive months of contraction.”
FIGURE 3: THE ISM MANUFACTURING INDEX ROSE TO 50.3 IN MARCH

Sources: Institute for Supply Management, Haver Analytics, First Trust
Against this economic backdrop, The Conference Board Leading Economic Index is showing a mixed picture: It has recently moved higher but continues to show signs of long-term weakness.
The Conference Board said of February 2024 data on March 21,
“‘The U.S. LEI rose in February 2024 for the first time since February 2022,’ said Justyna Zabinska-La Monica, Senior Manager, Business Cycle Indicators, at The Conference Board. ‘Strength in weekly hours worked in manufacturing, stock prices, the Leading Credit Index™, and residential construction drove the LEI’s first monthly increase in two years. However, consumers’ expectations and the ISM® Index of New Orders have yet to recover, and the six- and twelve-month growth rates of the LEI remain negative. Despite February’s increase, the Index still suggests some headwinds to growth going forward. The Conference Board expects annualized US GDP growth to slow over the Q2 to Q3 2024 period, as rising consumer debt and elevated interest rates weigh on consumer spending.’”
Figure 4: THE LEI’S YEAR-OVER-YEAR TREND REMAINS NEGATIVE

Sources: The Conference Board, Bureau of Economic Analysis
RECENT POSTS