


Pairs trading is an intuitive, easy-to-understand way to hedge your way into profits and minimize trading risk. Some refer to pairs trading as statistical arbitrage or market-neutral trading.
This strategy, which is typically underutilized by the retail investing community, entails going long one security while going short another. The pair, the short and the long, should be in the same industry sector, in relatively similar businesses within that sector, and highly correlated to each other in terms of the impact of the external economic and market environment. They are not as correlated in terms of market sentiment and current technical position.
The assumption underlying the investment thesis is that one of the securities is overvalued while the other is undervalued, based on any number of factors: management team, product line and new product introductions, marketing efforts, financial strength, margins, supply chain, etc.
Home Depot (HD) and Lowe’s (LOW) are a perfect example of an acceptable pair. Both are in the same industry and the companies compete with each other.
When I started trading in the pits of the New York Board of Trade, there were no futures “mini” contracts, and the NYSE Composite Index had a value well over a million dollars a contract. Pairs trading quickly became a crucial tool to mitigate the risk of my trades. For example, the Russell 1000 contract was highly correlated to the S&P 500 contract. Because the value, size, and content of these contracts were so similar, I could short one and go long the other—a classic pairs trade.
I clearly remember my father asking me how such a trade could make money. One of the contracts was overvalued while the other was undervalued, according to my analysis. The “expensive” contract would decline in value while the “cheap” contract would appreciate, both mean reverting in opposite directions. When this eventually occurred, I’d cover my positions and put the profits in my pocket. While these hedged trades did not make as much money as pure, all-risk, directional positions, they greatly reduced risk and had margin requirements that were minimal.
This translates beautifully to stocks.
The setup is simple: Find two companies in the same industry that offer similar products. Identify the overvalued and undervalued stock, and take corresponding long and short positions in each of identical value. We want the value of each position to be the same to keep exposure to both stocks as close to identical as possible.
For example, Teva Pharmaceutical Industries (TEVA) currently sells for about $7 a share while Mylan N.V. (MYL) has a share price of around $20. To make the pair tradable, you must roughly triple your position in TEVA in a trade against MYL. Both companies have had a great deal of bad publicity and are competitors in the generic drug market. Neither chart looks exciting; however, right here, right now, I would short one MYL and go long three TEVA. Should MYL take off to the upside, TEVA will likely follow (remember they are highly correlated). As TEVA plays catch up, the trade makes money.
If you drew an uptrend line under the lows of August for MYL and then a horizontal line from the peaks of August, you would notice that this stock is breaking out to the upside and will likely trade up to the 21–22 area. Above that level, there may be more aggressive breakouts to the upside. Even with that said, as a pairs trade, MYL would be the short and TEVA would be the oversold long.
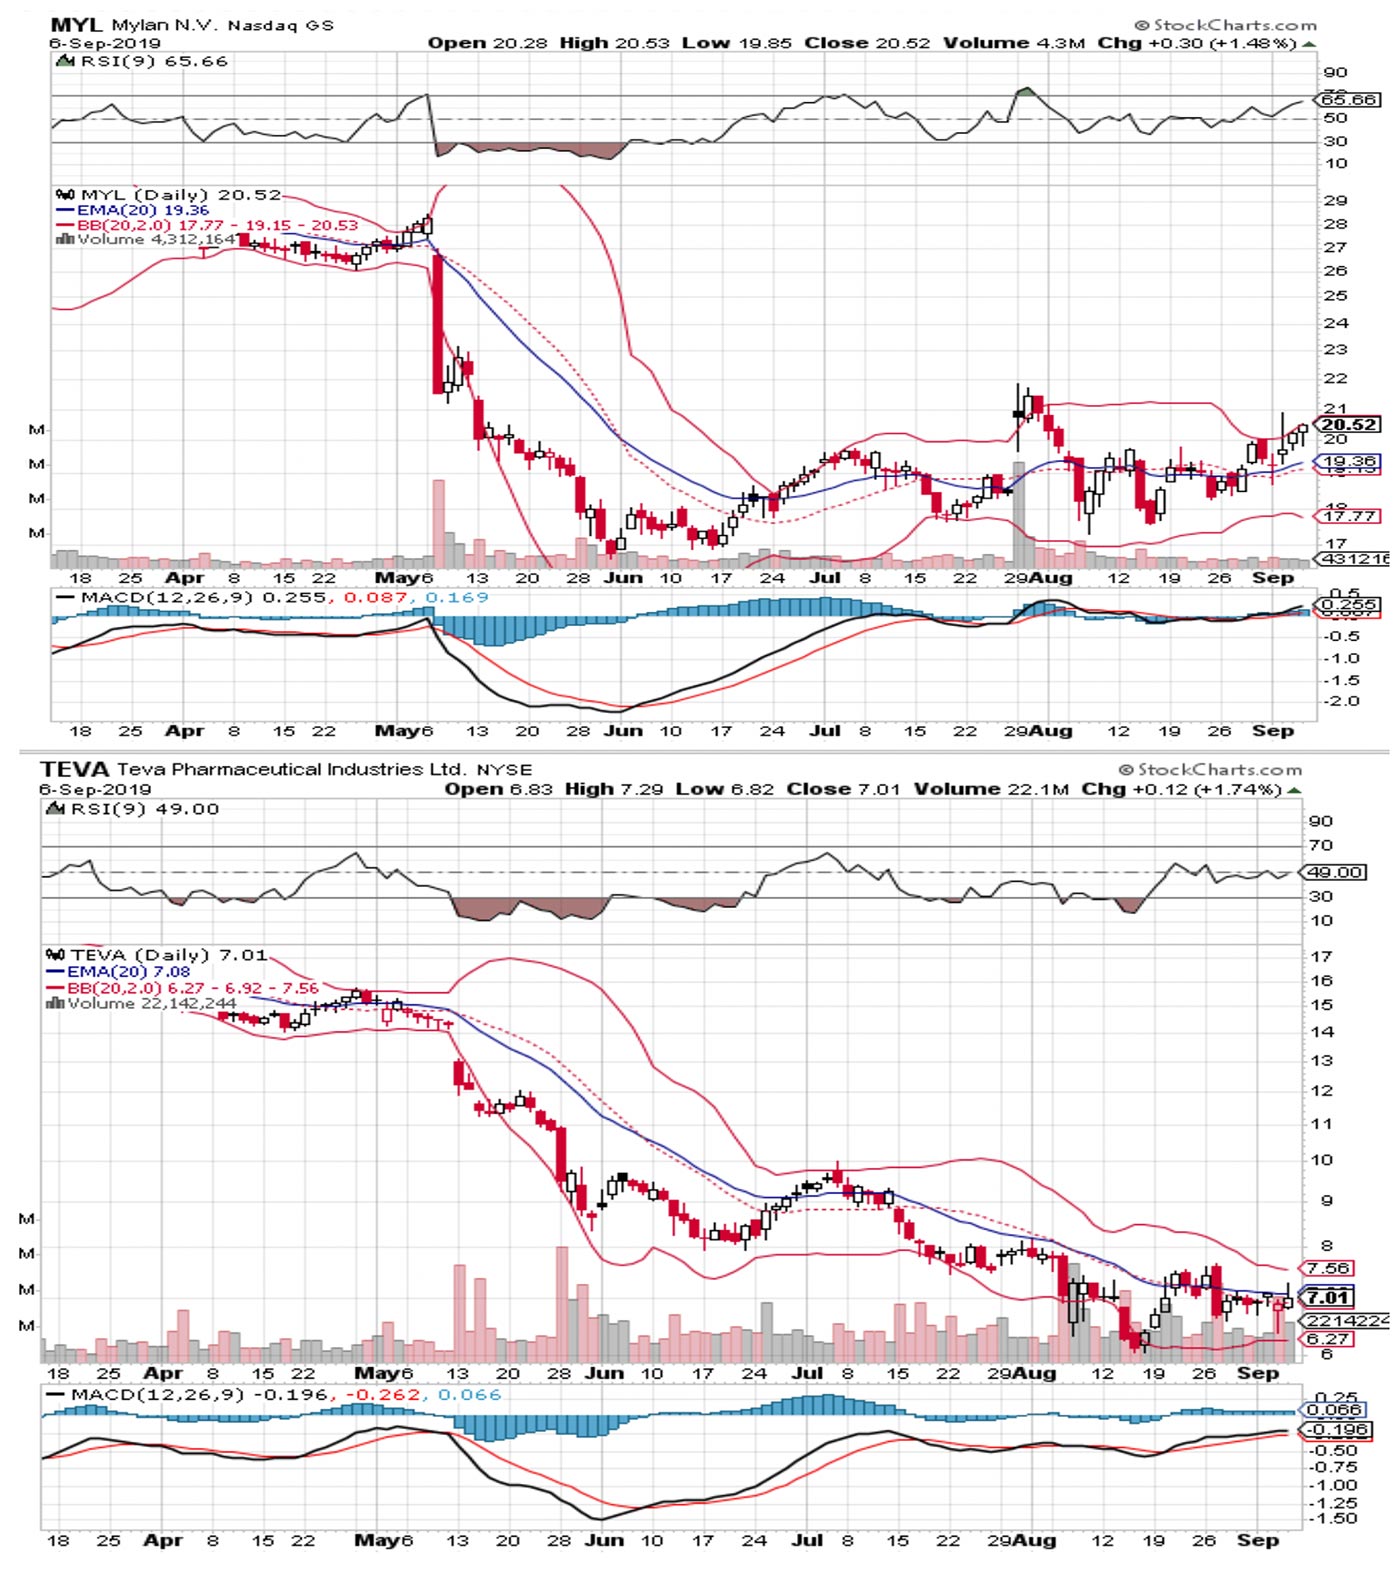
Source: Market data, charts from StockCharts.com. Data as of 9/6/19.
Square and PayPal, Home Depot and Lowe’s, Uber and Lyft—examples are everywhere. While pairs trading typically neutralizes a great deal of risk (remember, it is market-neutral trading), the greater the beta (the more volatile the underlying stocks), the greater the risk—even here.
In review, here are the steps to set up a pairs trade for the technical trader:
- Identify securities in the same line of business.
- Determine the overvalued and undervalued names (refer to technical analysis tools and charts).
- Gauge the correlation between the two securities (a correlation analysis and a number of other tools can be employed).
- Calculate the size of each leg of the trade.
- Develop a predetermined plan for closing out both winning and losing trades, using technical analysis to determine exit points.
- Have at it!
 Jeanette Schwarz Young, CFP, CMT, CFTe, is the author of the Option Queen Letter, a weekly newsletter issued and published every Sunday, and "The Options Doctor," published by John Wiley & Son in 2007. She was the first director of the CMT program for the CMT Association (formerly Market Technicians Association) and is currently a board member and the vice president of the Americas for the International Federation of Technical Analysts (IFTA). www.optnqueen.com