


We are around 50 market days into the new year, and the market has already taken out those estimates. According to Fortune, in a separate survey by Bloomberg of major firm strategists in March, the median S&P 500 2017 forecast had not changed much from December, rising “only 10 points.”
Fortune added, however, on the eighth anniversary of the bull market, “There are [now] some more optimistic views among those surveyed. Deutsche Bank has raised its forecast 200 points, to 2,600, and Bank of America has added 150 points to its prediction, bringing its estimate to 2,450.”
How can Wall Street do better with its estimates? I say learn from the techniques of the oddsmakers in Las Vegas. Seriously!
Take the over/under bet, a common football bet for the expected total points scored by both teams. For this year’s Super Bowl, it was set at a very high 58 combined points but moved to 56 ½ points after heavy betting.
That estimate turned out to be incredibly accurate. At the end of the Super Bowl’s fourth quarter, the score was 28 to 28, for a total of 56 points before heading into overtime. How gutsy was a call for a 56 ½ or 58 points over/under? Only 10% of all NFL games score that high or higher. The average NFL game ends with an over/under score in the low 40s.
But the over/under for this year’s Super Bowl, while very high, was warranted. Both teams boasted high-powered offenses, each capable of running up big scores. For the regular season, Atlanta was ranked #1, and the Patriots #3 in total points scored. Therefore, the secret of success for Vegas oddsmakers is looking closely at the two teams playing, and then digging deeper into their historical pattern of success on offense and defense to come up with the right number.
Wall Street strategists should do the same.
Wall Street’s 2017 estimate of 2,380 (Barron’s) was a call for about a 6% move higher. The average move is over 8% looking back over the past 28 years. So what were they thinking? Why did they believe the year would be below average?
If Wall Street had looked more at the “teams” that are showing up to play this year, their estimates would have been much different. They needed to look at the type of offense or defense we could expect in 2017.
The first consideration should be this: Is the market in a cyclical bull or bear? If it’s a cyclical bear, low or negative returns would be the norm. But that is not the case for 2017. The market finished a nine-month rolling correction of 15% from May 2015 through February 2016. The low one year ago marked the start of a new cyclical bull market move. Cyclical bull markets typically post good annual gains.
The second consideration should be this: Is the market in a secular bull or bear? This will again tell us how strong the offense or defense is and what we should expect as a result. As an example, drops in secular bears can be horrific (2000–2002 and 2007–2009 had drops of more than 50%), and annual gains will be muted. But just the opposite occurs in secular bulls: gains will be high scoring and pullbacks shallow.
ANNUAL GAINS IN CYCLICAL BULL MARKETS IN A SECULAR BULL MARKET
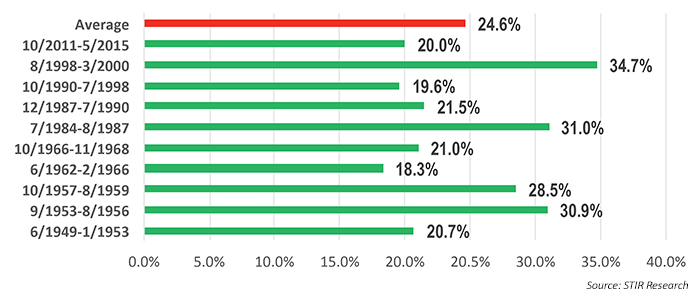
So, which “stock market team” is showing up to play for 2017?
We would put the team jersey on a cyclical bull in a secular bull. Looking at historical numbers (like the Vegas oddsmakers) for the past 10 cyclical bull markets in secular bulls, the average gain is more than 24%. That being the case, a better over/under call for 2017 is a double-digit return in the 20% range.
The opinions expressed in this article are those of the author and do not necessarily represent the views of Proactive Advisor Magazine. These opinions are presented for educational purposes only.
 Marshall Schield is the chief strategist for STIR Research LLC, a publisher of active allocation indexes and asset class/sector research for financial advisors and institutional investors. Mr. Schield has been an active strategist for four decades and his accomplishments have achieved national recognition from a variety of sources, including Barron's and Lipper Analytical Services. stirresearch.com