Volatility has returned to the U.S. equity markets, largely attributed to a more hawkish Federal Reserve, inflation and supply-chain concerns, and the unknowns surrounding the omicron variant of COVID.
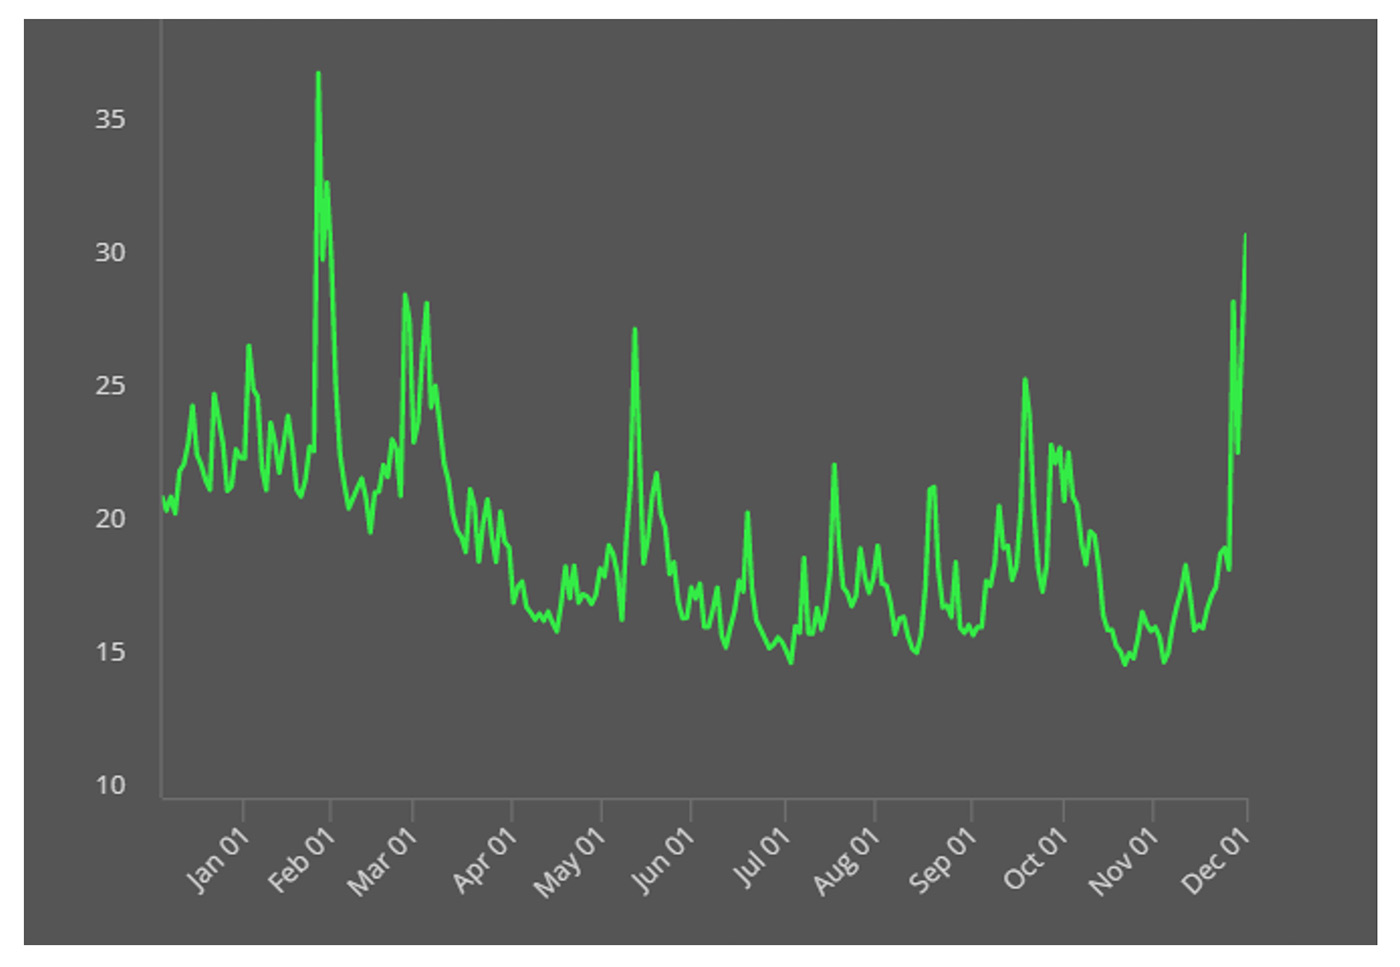
The Cboe Volatility Index (VIX) spiked to over 30 last week, the highest level since January 2021. As we have seen in recent weeks, volatility often cuts both ways—to the upside and downside. Many studies have shown how the “best” and “worst” days in the market often cluster together.

Source: Cboe, data through 12/4/2021
Barron’s commented on the market’s volatility and headwinds this past weekend:
“The S&P 500 finished the week 3.5% off its 2021 high, which is a bit less than the index fell in September, when everyone was predicting a correction that never arrived. This selloff looks like it has more legs. Gone are the generalized fears about valuations and a looming earnings season—which turned out to be just fine—replaced by a new Covid variant and the start of the Federal Reserve’s tightening cycle.
“Omicron was bad enough on its own—no one knows how much it will hurt the economy—but then Fed Chairman Jerome Powell had to go and acknowledge that inflation isn’t transitory after all and the taper might have to go faster than expected.”
An article by Bloomberg appearing in The Washington Post also noted that last week’s jobs report—while disappointing in its top-line jobs growth—may also encourage a now seemingly more hawkish Federal Reserve:
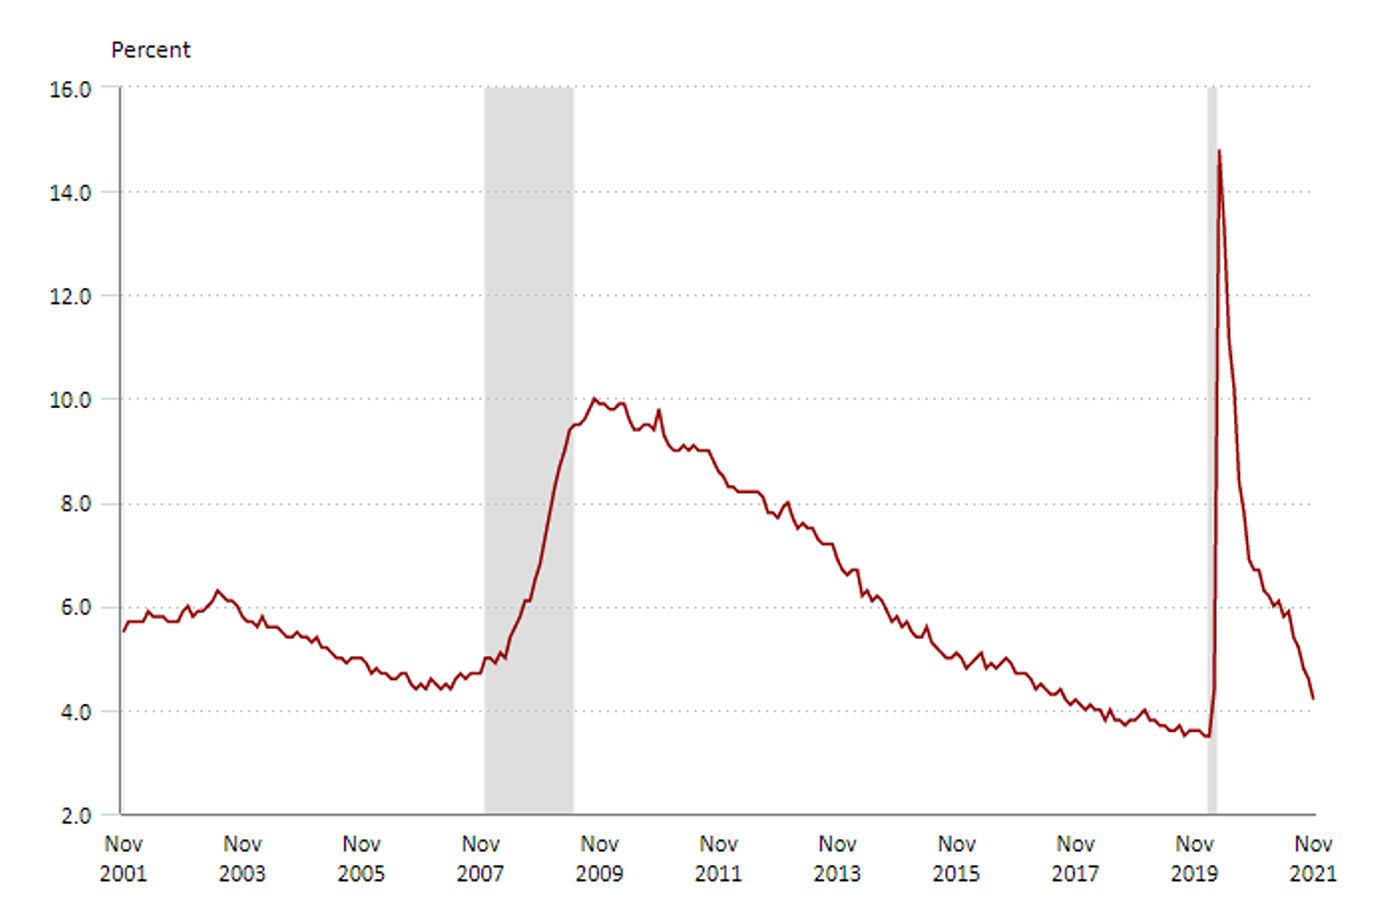
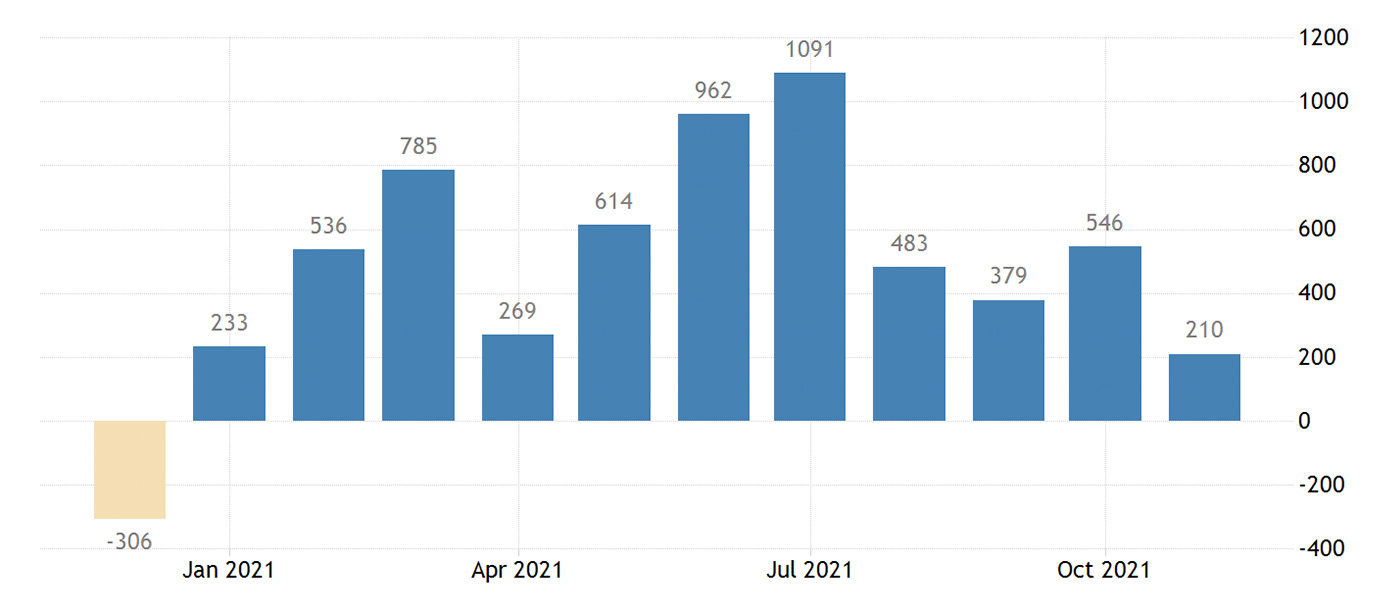
“Two headlines hit at the same time. The bad one: U.S. employers added just 210,000 workers in November, less than half of the median estimate in a Bloomberg survey of economists, which called for a 550,000 gain. The good one: The unemployment rate tumbled to 4.2%, down from 4.6% and beating estimates for a more modest dip to 4.5%. …
“While it was far messier than expected, the November jobs report is unlikely to cause the Federal Reserve to rethink accelerating the pace of its tapering after its meeting later this month. … In September, no official saw the jobless rate falling below 4.5% by the end of the year. By that measure, the labor-market recovery is ahead of schedule in their eyes. …
“The simple fact remains that Fed Chair Jerome Powell and other policy makers are squarely focused on containing inflationary pressures that they now acknowledge risk becoming more persistent than they initially anticipated.”

Note: Shaded areas represent recessions.
Source: U.S. Bureau of Labor Statistics

Note: Data through November 2021.
Sources: Trading Economics, U.S. Bureau of Labor Statistics
***
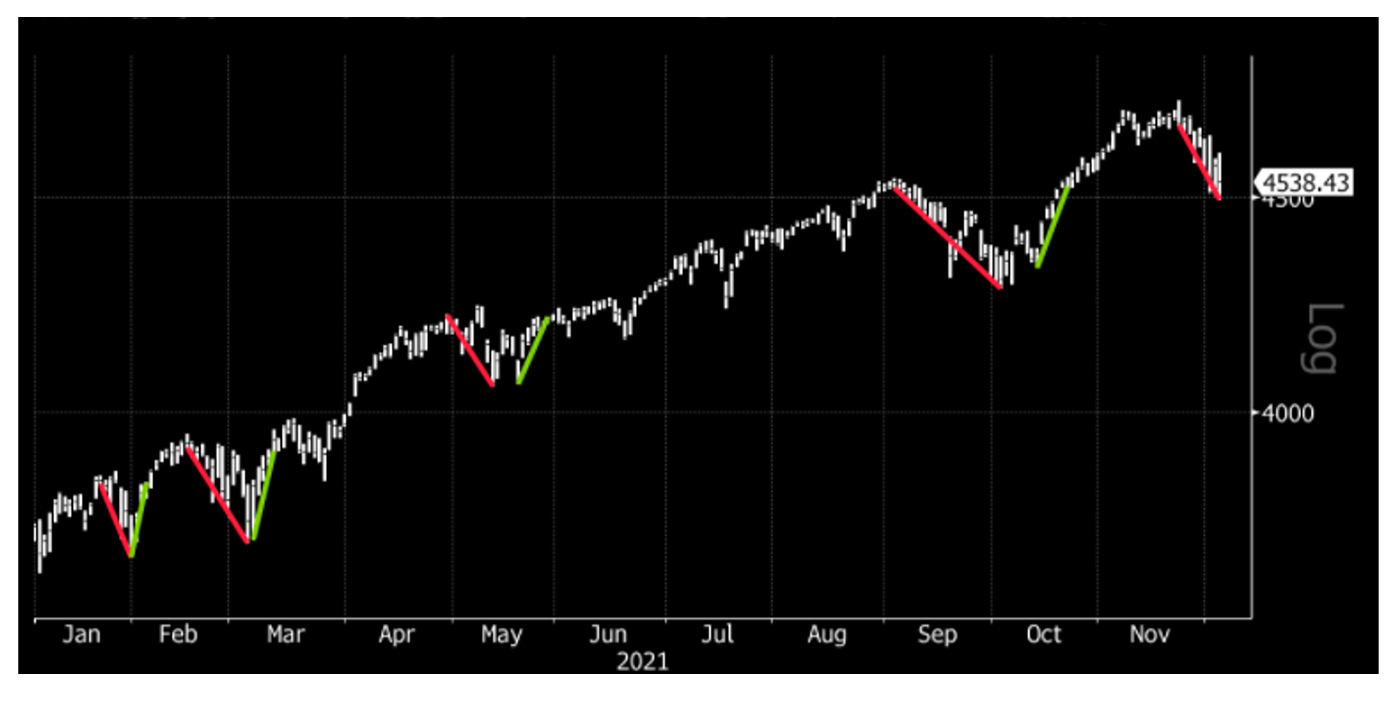
Circling back to the market’s volatility, and the clustering of “best” and “worst” market days, Bloomberg recently issued an interesting chart showing how 2021’s market action in the S&P 500 has been characterized by enthusiastic “dip buying.”
Bloomberg writes,
“The S&P 500 Index has dropped as much as 4% since the Black Friday selloff, and hasn’t had a technical correction of 10% or more all year long. Instead, stocks have had shallow, albeit more frequent pullbacks of 4% to 5%, which are followed by quick rallies. The speed of the bounce-backs is noteworthy. It only takes about half the time to recover lost gains than the drop itself.”

Source: Bloomberg
