10 best/worst market days: Does it matter?
10 best/worst market days: Does it matter?

It’s not about missing the best or worst days of the market; it’s about staying with a disciplined investment plan for the long run.
One fail-safe sign of individual investor uneasiness in the financial market is the appearance of the “Missing the Best Days” argument in the media. The gist of this argument is that investors should avoid moving capital to the sidelines because doing so risks missing the best days of the market, and this will cause their returns to plummet.
Many advocates of active management argue that missing the market’s best days doesn’t matter if you also miss the worst.
Which argument is correct? They both are. There’s just one small problem. They are both statistically next to impossible to achieve. They assume absolute accuracy—picking the correct 10, 20, 30, or 40 days out of decades, with an average of 252 trading days per year.
Because the best and worst days of the equity markets historically tend to occur during periods of market volatility, an investor who moves to the sidelines to avoid daily uncertainty could miss both the best and worst days.
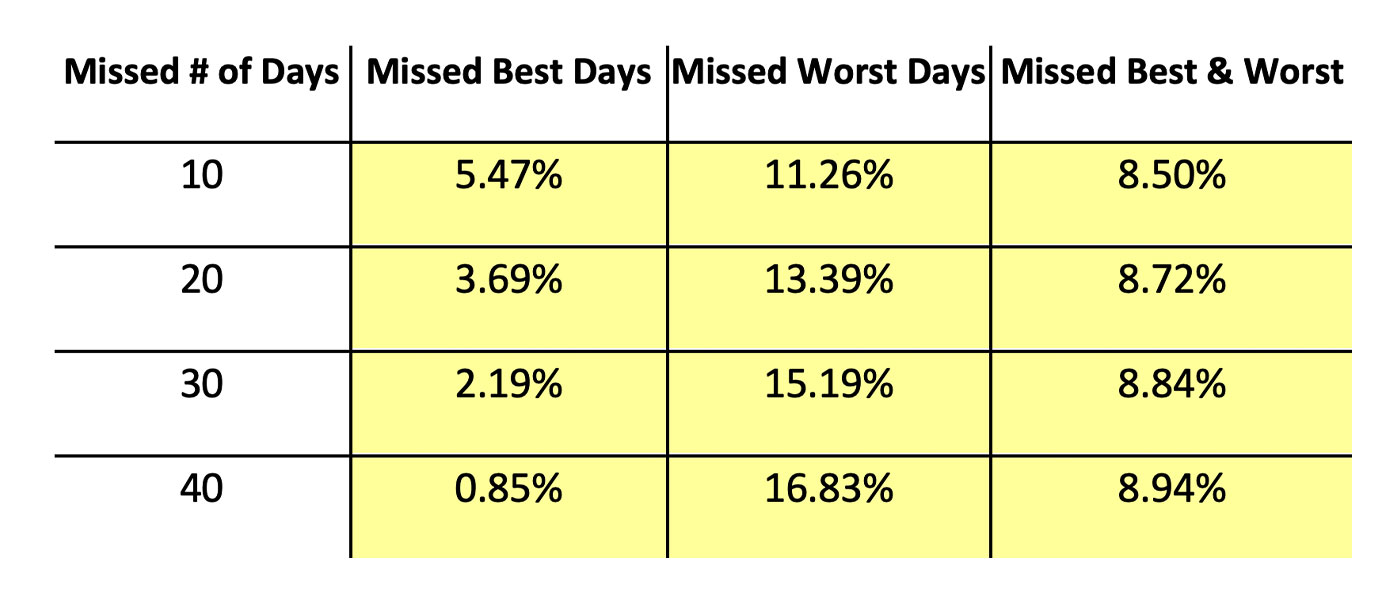
To determine what that means in terms of performance, let’s take a look at the following table. It has been updated annually for the last 20 years by investment advisor Will Hepburn, vice president of investment research with Shadowridge Asset Management LLC.
TABLE 1: IMPACT ON ANNUAL RETURNS OF MISSING THE MARKET’S BEST AND WORST DAYS (1/2/90–12/30/20)

Note: The S&P 500 is an unmanaged index of stocks considered representative of the broad stock market. Investors cannot invest directly into an index. Data includes reinvestment of dividends. This study was conducted by Will Hepburn, vice president of investment research, Shadowridge Asset Management LLC. Copying and use are permitted with attribution.
Source: Yahoo Finance
The S&P 500 has had some remarkable up days over the last 30 years. In 2020 alone, the Index was up over 5% on March 17 and 26, and over 9% on March 13 and 24. If all an investor did was miss those days, there’s no surprise that their returns would fall. On the flip side, 2020 brought some nasty down days, with one-day losses of 12% on March 16, over 9% on March 12, in excess of 7% on March 9, and more than 4% on March 20. As the table indicates, investors who somehow missed those days of steep losses could expect to have higher returns than the S&P 500.
The most interesting data, however, comes when you look at the impact of missing both the best and worst days. The reason that missing both the best and worst days increases one’s returns and dramatically reduces volatility is the math of gains and losses. Every time you lose money in the market, you lose future investment potential and the benefits of compounding. It doesn’t take a 25% gain to recover from a 25% loss—it takes 33%. The case for risk management, therefore, becomes clearer.
The returns from missing both the best and worst days are remarkably close regardless of whether one misses 10 very bad days and 10 great days or 40 very bad and 40 great days. This is one consistent result of the study for every period considered. All four data points also end up close to the S&P 500 Index return for the period, often outperforming a buy-and-hold position. Not by much—but over many years, even a fraction of a percentage point adds up. We are still talking statistical impossibilities, but we are also getting to the heart of managing risk and return.
In considering the data presented above, it is important to keep in mind a few fundamental market “realities”:
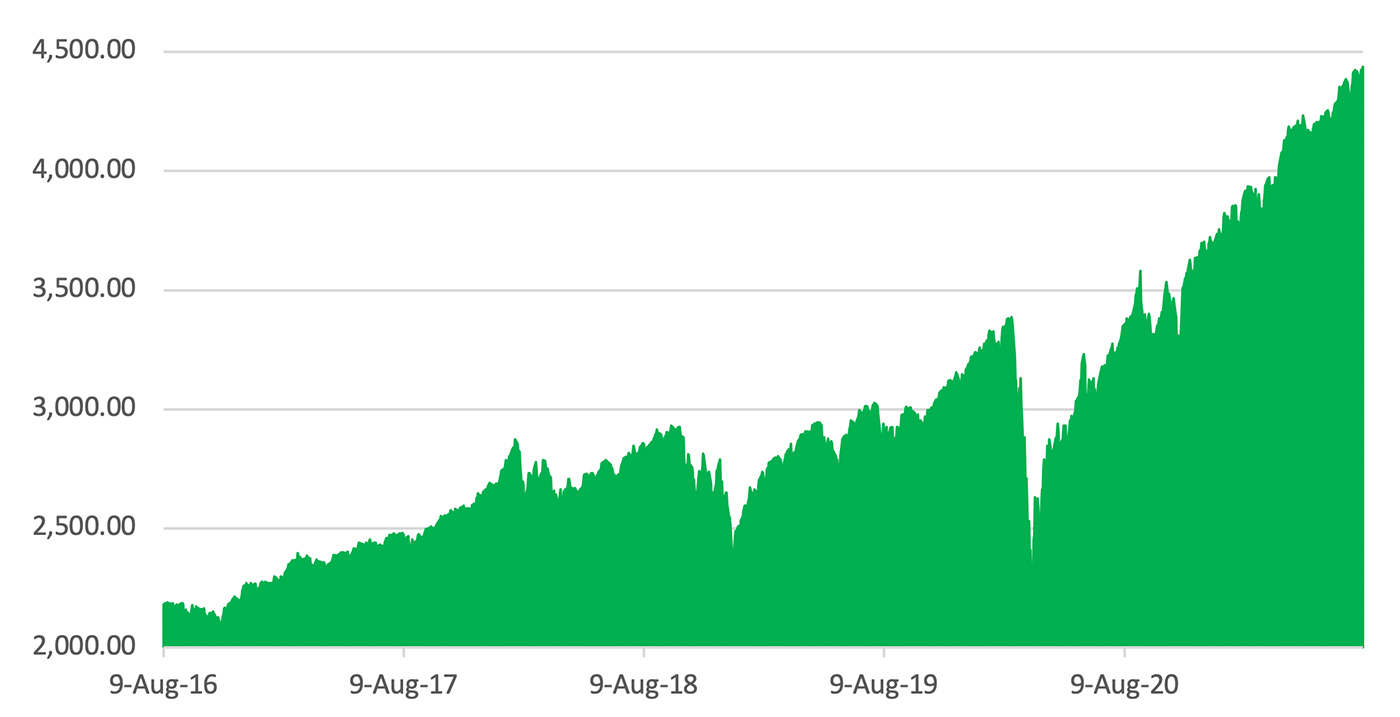
- Good days outnumber the bad days. In the five years shown in Figure 1 below, there were 569 down days compared to 689 up days. (The 54.7% of up days for this period is close to the average for the past six decades.)
- Recovering from bad days is difficult because you have a smaller balance to compound.
- Remember the mathematics of making up portfolio losses. In an extreme but historically relevant example, it doesn’t take a 50% return to recover from a 50% loss, it takes a 100% gain.
- Bad days and good days are not random—numerous studies show that they tend to cluster together.
- Trends are real, whether cyclical or secular bear or bull markets
- It’s hard to beat a broad market index such as the S&P 500.
- It’s easy to dramatically underperform a broad market index.
In the 2013 Berkshire Hathaway shareholder letter, Warren Buffett recommended a very simple portfolio for the individual investor: 90% in an S&P 500 index fund and 10% in a low-cost, short-term U.S. government bond index fund. This portfolio, he predicted, would outperform high-fee managers over the long term. Not surprisingly, since 90% of the portfolio is composed of the S&P 500 index fund, the result over the last seven years has closely tracked the S&P 500. And there is the problem.
The S&P 500 Index is volatile. Its value is a reflection of the expectations and fears of investors worldwide with every move accentuated by computerized trading systems seeking fractional pricing advantages. The memory of the crash of 2000 when an estimated $8 trillion of wealth was lost is still very fresh. The market was nearing breakeven in 2008 when a second jolt sent it down 42%. The most recent was the “coronavirus crash,” 33 devastating days from Feb. 19 to March 23, 2020.

Note: Data reflects five years ending Aug. 6, 2021
Source: Yahoo Finance
The problem with market declines is that no one knows how much will be lost, how long the fall will last, or how much time it will take to recover. It doesn’t matter how good a portfolio might potentially perform if the investor is unable to stay the course during bear markets.
Unfortunately, real people tend to sell when the pain is the greatest and then hesitate to re-enter the market until they have missed too many “good” days. It’s not that they are stupid. It’s that they don’t have sufficient funds that they can afford to wait a decade to recover. It’s “easy” to sit out a market crash with a $1 billion portfolio and no immediate need for all $1 billion. Watching a $500,000 retirement portfolio whittled down to $300,000 can be devastating.
This is where the results of missing the best and worst market days are so important. While no investment manager will ever miss just the best and worst days, by reducing portfolio volatility and enabling investors to stay with their investment plan for the long term, the potential for investment success is enhanced.
Achieving the return of the S&P 500 Index requires taking on a great deal more risk than most individual investors can tolerate. With an investment approach designed to reduce stomach-churning drawdowns, but still capitalize on the market’s long-term upward trend, investors may not achieve S&P-500-level returns every year. But they are more likely to stay with a disciplined and risk-managed portfolio approach over the long haul. Because, in the end, it really is time in the market that counts.
 Linda Ferentchak is the president of Financial Communications Associates. Ms. Ferentchak has worked in financial industry communications since 1979 and has an extensive background in investment and money-management philosophies and strategies. She is a member of the Business Marketing Association and holds the APR accreditation from the Public Relations Society of America. Her work has received numerous awards, including the American Marketing Association’s Gold Peak award. activemanagersresource.com
