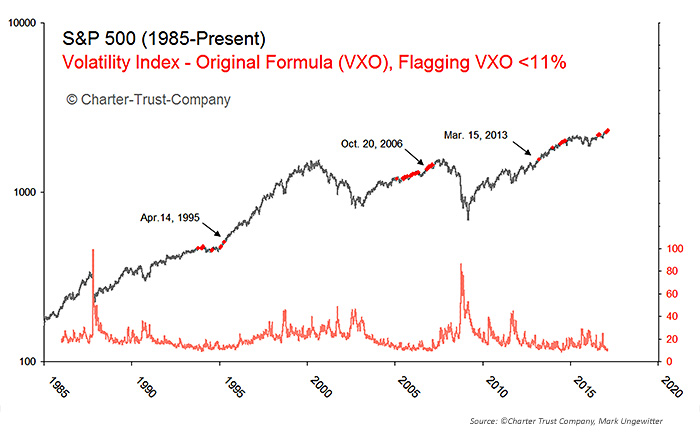
“We keep hearing that today’s near-record-low volatility is signaling an imminent market top. To test this proposition, we examined implied volatility back to 1986 using the VXO index. (VXO behaves similarly to VIX, with the advantage of a longer track record.)

Friday’s VXO reading of 10.3% was a near-record low. Weekly readings below 11% are rare events, occurring only 3.6% of the time. The chart below flags all such occurrences in red. Most of the time, the market has moved significantly higher after it enters a super-low volatility environment.
We conclude, therefore, that today’s low implied volatility is not sufficient reason for a market top. Historically high volatility, on the other hand, is a good indicator of market bottoms.”
Title: S&P 500 VS. VXO VOLATILITY INDEX (1985–PRESENT)

Detecting market tops is difficult work, so all analysis is welcome. But let’s make sure we support our reasoning with factual evidence. Many tests prove negative … and that’s OK too. It’s good to know what doesn’t work, as well as what does.
Conclusions?
- Many analysts are calling for a market top based upon historically low implied volatility.
- But this line of reasoning doesn’t hold up to empirical testing.
- The market often goes much higher after entering a super-low volatility environment.
The opinions expressed in this article are those of the author and do not necessarily represent the views of Proactive Advisor Magazine. These opinions are presented for educational purposes only. This article was originally published on 1/23/17 at chartertrust.com.
 Mark Ungewitter is a senior vice president and investment officer at Charter Trust Company. He is also a frequent contributor to a variety of financial publications and websites. Mr. Ungewittter was previously director of portfolio management at Investors Bank and Trust. He is a member of the American Association of Professional Technical Analysts. www.chartertrust.com
