

The reason we all like to remind ourselves of it is because it’s incredibly easy to get lost in short-term market gyrations. Such loss of perspective often leads to costly, ill-timed mistakes and overtrading. However, the primary market trend is not always particularly easy to decipher. This is why it’s important to employ an objective, rules-based methodology in order to properly identify the primary trend. When investors are near certain of the primary trend, they are able to possess the conviction necessary to buy when others are selling (during bull trends) and to sell when others are eagerly buying (during bear trends).

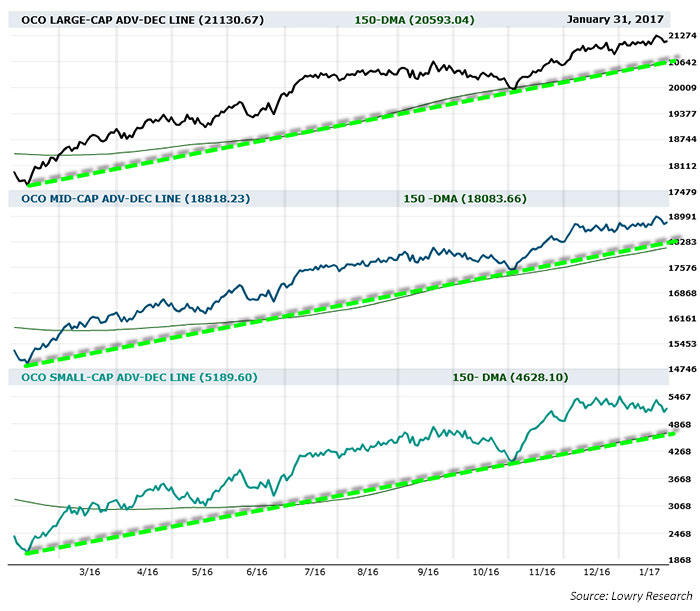
The next major corroborative signal in confirming and monitoring the health of the primary trend is Lowry’s Operating Companies Only (OCO) Segmented Advance/Decline Lines as shown in the following figure. Lowry’s OCO stocks are exactly what they sound like, just the operating companies/common stocks—not the preferred stocks, not closed-end bond funds, and not ADRs. The concept is to isolate the stocks in the given index for a more accurate view of the traditional all-issues Advance/Decline Line. Taken a step further, the segmented portion refers to breaking out the OCO index by market capitalization. This again helps us to understand more about market internals and what is driving the market. As seen in the chart below, Lowry’s OCO Segmented Advance/Decline Lines are at or near new all-time highs for all three market cap segments. This action lends further credence to the advance with the knowledge that breadth is exceptionally healthy. By contrast, in an unhealthy market, near a major market top, these Advance/Decline Lines typically diverge from price index gains for 4 to 6 months on average (but as long as two years) before an eventual major market decline begins—1929, 1972, and 2000, for example.
The opinions expressed in this article are those of the author and do not necessarily represent the views of Proactive Advisor Magazine. These opinions are presented for educational purposes only.
 Vincent Randazzo, CMT, is a senior market analyst at Lowry Research with more than 15 years of experience in professional equity market research, technical analysis, and market intelligence. Before joining Lowry, Mr. Randazzo was chief market analyst at NASDAQ. He was also director of research at ICAP and a research salesperson at Morgan Stanley and UBS. He has been a Chartered Market Technician (CMT) since 2008. For more information on Lowry Research, please visit lowryresearch.com.