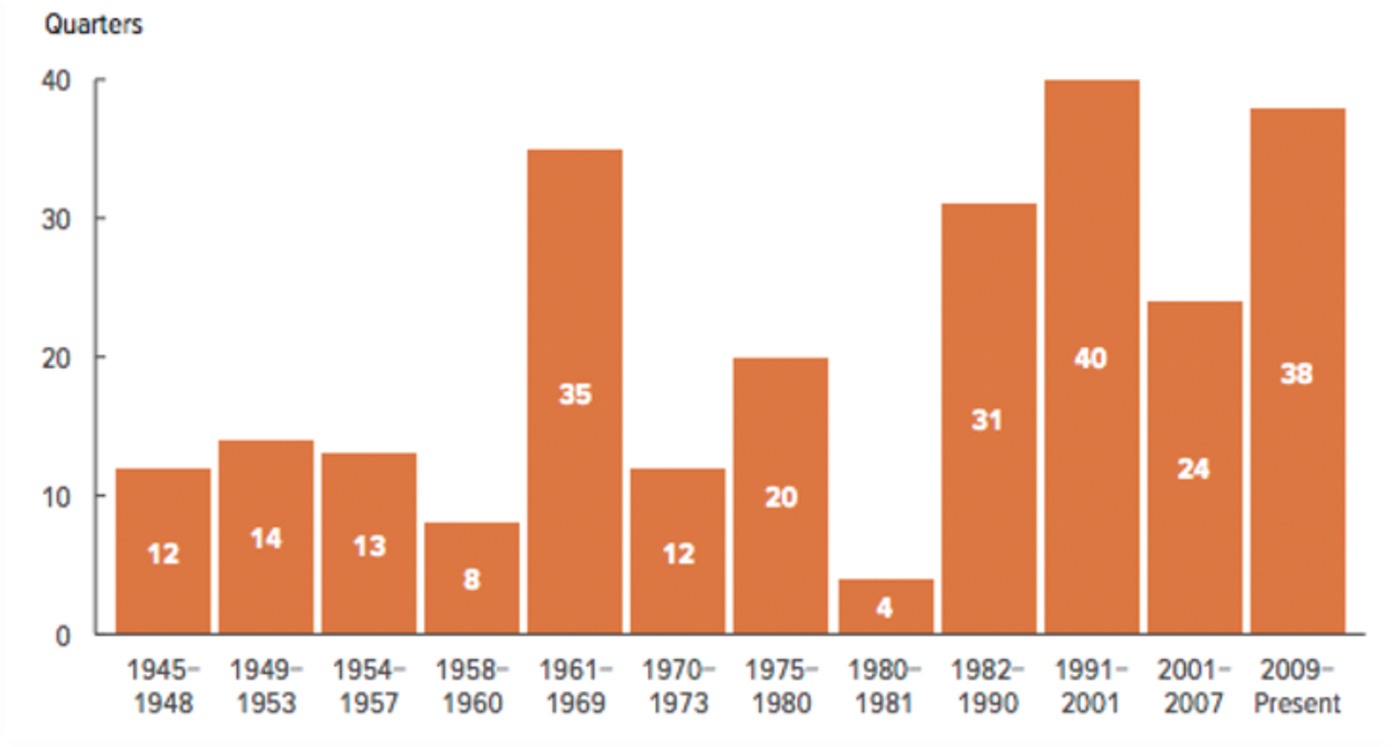
According to a recent Forbes article, “The current economic expansion has lasted more than nine years (38 quarters), about four years longer than the average expansion since 1945.”

Source: Forbes, Congressional Budget Office
That raises the question: How much longer can the economic expansion and a bullish stock market continue?
U.S. equity markets moved powerfully higher last week, despite weaker-than-expected job data and generally poorer economic reports across the board.
According to Bespoke Investment Group,
That said, concerns remain among major institutional investors and other market participants as to the current state of interest rates. On CNBC, Leuthold Group’s chief investment strategist Jim Paulsen said in an interview,
“The Fed needs to take out the inverted curve fear more than they need to address the fundamental fallout from the trade war. If they do that, then I think the underlying economy is going to be OK and the stock market goes on to new highs.”
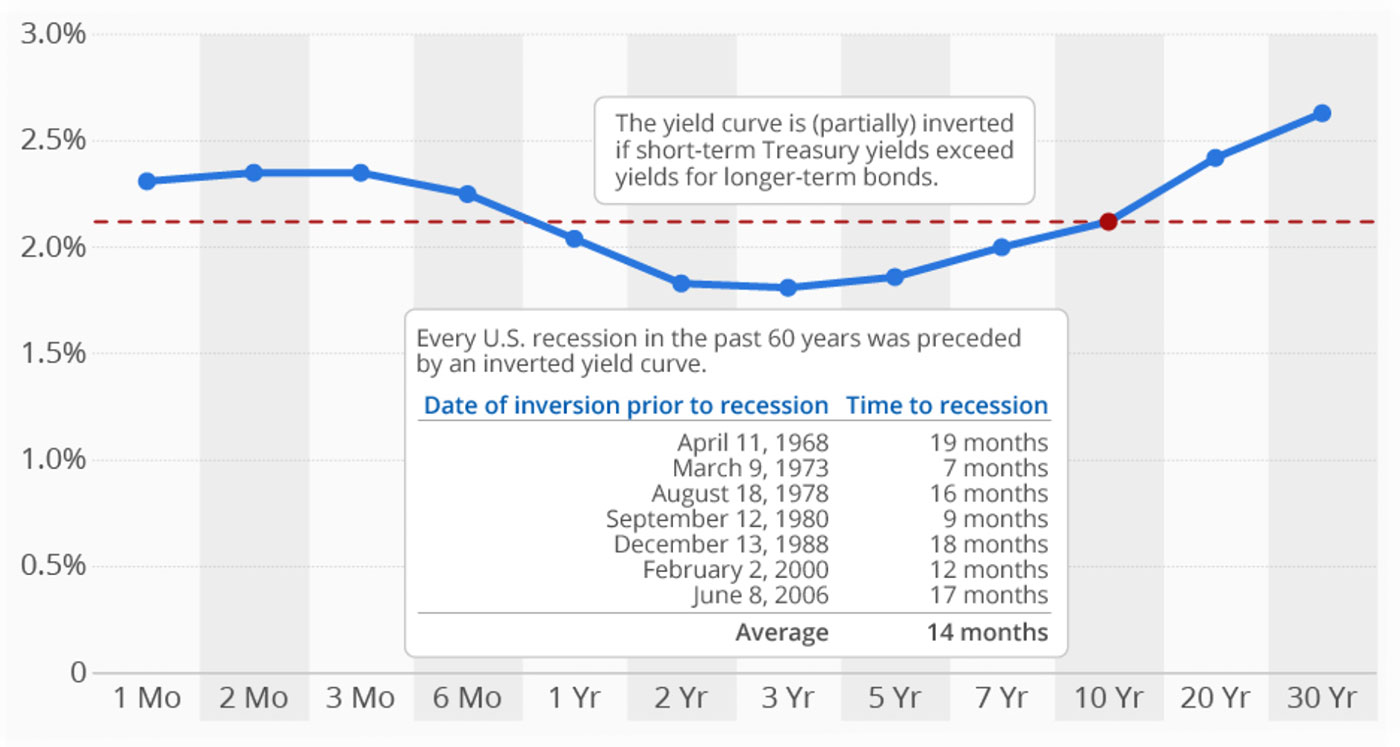
“The yield curve shows how much it costs the federal government to borrow money for a given amount of time, revealing the relationship between long- and short-term interest rates. It usually slopes upward, meaning that the yield is higher the longer your money is tied up, reflecting the fact that long-term investors bear a higher risk. If the yield for bonds with short maturity exceeds the yield for longer-term bonds, this is called an inverted or partially inverted yield curve, which is what we’re currently seeing. On June 5, the yield on 10-year Treasury bonds closed at 2.12 percent, close to Monday’s 20-month low of 2.07 percent. Meanwhile a 30-day Treasury bond is yielding 2.31 percent, meaning that short-term lenders receive a higher yield than those tying up their money for 10 years.
“So what does that mean? ‘The term spread—the difference between long-term and short-term interest rates—is a strikingly accurate predictor of future economic activity,’ Michael D. Bauer and Thomas M. Mertens found in a 2018 Federal Reserve research paper, adding that ‘every U.S. recession in the past 60 years was preceded by a negative term spread, that is, an inverted yield curve.’ So should we all be bracing for an imminent recession? Not quite. The current inversion is relatively shallow with the spread between the 10-year and the 3-month yield standing at -0.23 percent. According to the New York Fed that translates to a 30 percent risk of a recession occurring within the next 12 months, which is substantial but far from a certainty.”
FIGURE 2: INVERTED YIELD CURVE—AN OMINOUS SIGN?

Source: Statista, U.S. Department of the Treasury
The Forbes article further notes that perhaps the nature of an inverted yield curve as a recession indicator has changed over the past decade, “One mitigating factor with this signal is the large amount of intervention the Federal Reserve has done to prop up the economy from the Great Recession. By keeping interest rates at very low levels for years and inflating its balance sheet to over $4 trillion, these moves could make this indicator less reliable.”
