
Using cash to manage risk and create alpha
Using cash to manage risk and create alpha

An actively managed strategy that moves to cash in times of market stress can effectively mitigate risk, reducing drawdowns and overall portfolio volatility. This is especially important for clients in retirement who are taking regular portfolio withdrawals.
When I was 16, I worked in a local greenhouse and saved as much money as I could to buy a car. The cost of buying a car also included the steep cost of insurance, which was especially expensive for a new driver. Fortunately, my parents were willing to help me out with that. Although it was nothing special, I really enjoyed having that car to drive to and from work and buzz around our small town with friends.
It wasn’t until I had been driving for a few years that I found out what it was like to be in an accident.
My car was the third car to be hit in a five-car pileup. It wasn’t a bad wreck, but my car was totaled, and I was mentally shaken. The images right after being hit are permanently seared into my mind. I was fortunate it wasn’t worse. At that point, I learned two things:
- Accidents happen in the blink of an eye, faster than anyone can do anything about.
- The value of insurance—of managing risk—is immense.
The perils of complacency
It’s almost hard now to remember what a market crash feels like. Markets are in one of the longest bull markets in history (depending on how you measure it), and economists don’t expect another recession until 2020, according to a survey from The Wall Street Journal.
The phrase “breaking news” flashes across the screen when markets are down a percent or two for the week. Watch Bloomberg TV or CNBC long enough and reports of the markets’ new highs are constantly discussed, along with rosy predictions for more gains.
Although there are a few naysayers in the financial media, it’s as if the entire investing population has forgotten the pain of 2008, when the market dropped nearly 8% in a single day on reports of very poor retail sales and predictions of the worst recession since the 1980s. By the end of October 2008, the major equity indexes lost more than 10% and finished the year down just short of 40%. Accidents happen in the blink of an eye.
Accidents are fundamentally the reason insurance companies exist. Insurance companies help protect against unforeseen losses, which is akin to what risk-focused investment managers do. In a situation like 2008, minimizing losses is the most desirable outcome for almost all investors, though many professional managers will seek to make a profit in any environment. Risk managers use all of the tools available to mitigate losses, reduce volatility, and do the best possible job at following Warren Buffet’s primary rule: “Don’t lose money.”
Why cash can be both a defensive and offensive tactical tool
Some of the tools available for risk management are cash, inverse (short) funds, and options. Cash provides a stable value, short funds are a direct contrarian stance on the market at a point in time, and options can be used to provide a convex payoff curve. For the purposes of this brief overview, only cash will be analyzed. This example provides a situation with two assets based on the well-known crossover of the 50-day and 200-day moving averages.
Cash, as a store of value, earns on average the risk-free rate regardless of the equity market direction. To determine its effectiveness as part of a risk-managed framework, consider not only the resulting compounded annual growth rate (CAGR) but also the alpha effect of cash on the portfolio over time as a whole. Alpha, in this context, is defined as the underperformance or outperformance of an asset relative to another.
In a two-asset hypothetical example, cash experiences a positive alpha when it outperforms the S&P 500 and negative alpha when underperforming. Figure 1a represents what the annualized return of cash looks like at different return levels of the S&P 500, assuming cash returns 1%. Figure 1b represents the alpha of cash given certain returns of the S&P 500. In reality, the return of cash varies with interest rates, which are near historical lows.
FIGURE 1: CASH RETURN AND CASH ALPHA RELATIVE TO S&P 500
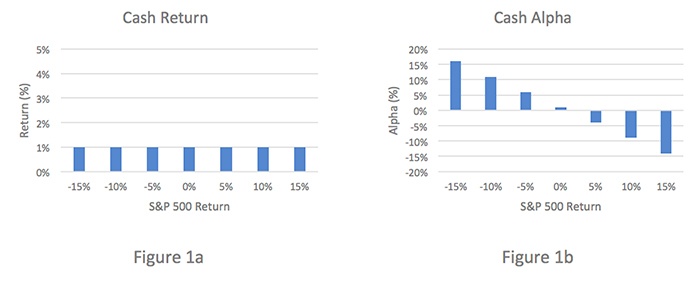
Source: W. Hubbard
Regardless of the return of the S&P 500, in the hypothetical example above, cash offers a consistent return of 1% annually and demonstrates the ability to add tremendous alpha to client portfolios during market downtrends. This is why it can be desirable to switch between a cash and equity position.
The following example analyzes a strategy that tracks the crossovers of the 50-day and 200-day moving averages from February 2005 through February 2018—a period encompassing the Great Recession and one of the longest bull market rallies in history.
Figure 2 highlights the S&P 500 index over this period. The light-blue shading represents periods of drawdown from market peak to trough. These peak-to-trough moves make up 30% of the analysis period. Despite a raging bull market, investors still spent nearly one-third of the time in decline. It’s these declines that violate Warren Buffet’s rule of “don’t lose money.” Losing money one-third of the time is like experiencing a fender bender one out of every three times that you get behind the wheel—which is why risk management is so important.
FIGURE 2: PERIODS OF MARKET DRAWDOWN (2005–2018)
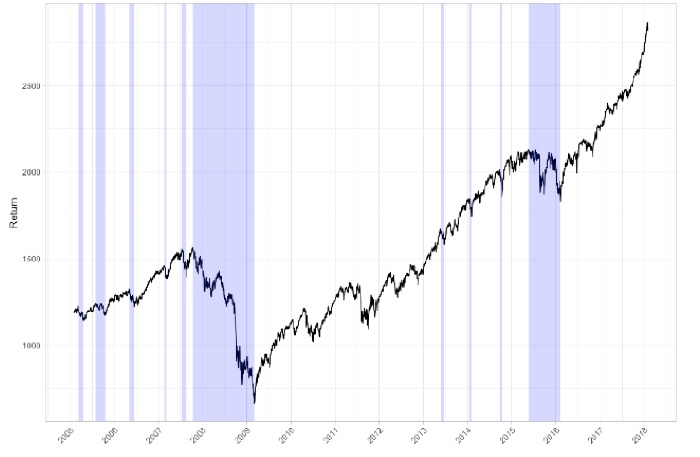
Source: W. Hubbard. CBOE market data covering the period 2/2005–1/2018 for S&P 500.
By applying a simple moving-average crossover strategy, risk can be effectively mitigated, reducing drawdowns and overall volatility, two things that substantially decrease the likelihood that an investor will outlive their savings.
Figure 3 shows how a simple algorithm, applied historically, mitigates drawdown, but also reduces some upside in times of short-term turmoil. For illustration purposes, the strategy uses an annualized 1% return for cash when the 50-day moving average is less than the 200-day moving average. When the 50-day moving average is greater than the 200-day, the return for the S&P 500 is assumed as the return. To mitigate any bias on the signal day, a lagged signal is used to allow the hypothetical investor one day to place trades.
FIGURE 3: MOVING-AVERAGE CROSSOVER STRATEGY VS. S&P 500 (2005–2018)
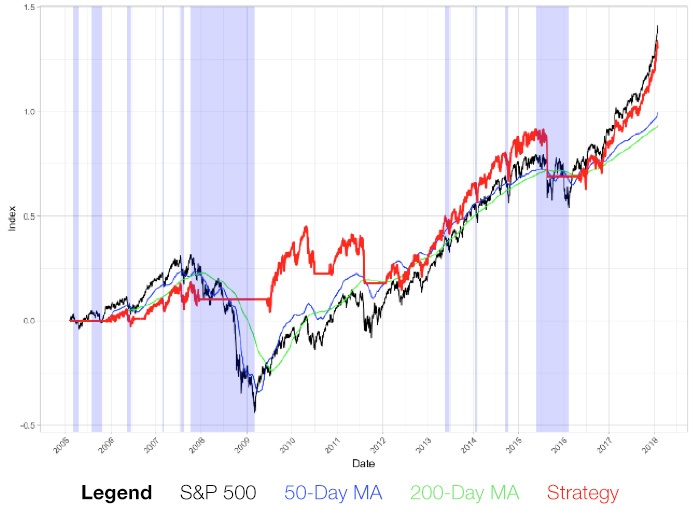
Source: W. Hubbard. CBOE market data covering 2/2005–1/2018.
Three things are clear in Figure 3.
First, 2008 is handled well by the cash-switching strategy. Second, the market catches back up relatively quickly as the alpha effect produced by holding cash declines. Third, the market outperforms a moving-average crossover strategy over the entire period. This assumes investors can stomach the jaw-dropping volatility of 2008–2009. Research studies indicate this was not the case for many investors during that period—or in other times of great market stress as well.
Related to the first point, drawdowns are handled extremely well by a moving-average crossover strategy. In the case of 2008–2009, the drawdown of the S&P was 55%, while the crossover strategy experienced a drawdown of 21%. Not only did the moving-average crossover strategy reduce drawdowns, but it also decreased the volatility of the portfolio from 17.7% to 10.7%, a 40% reduction.
The major critique of this strategy is the end portfolio value, since a strategy that moves to cash ultimately adds somewhat less value than a buy-and-hold strategy for the S&P 500.
This is a valid point; however, the purpose of active management is to smooth out the returns and reduce risk to investors through time. In this case, the net reduction in total return between a buy-and-hold strategy and the moving-average crossover is just 7.3%. That means the buy-and-hold strategy added around 0.5% annualized compared to a risk-managed strategy such as the moving-average crossover.
Portfolio risk management is critical for retirees
Clients who are in retirement or withdrawing funds for personal reasons (a house purchase or funding college, for example) are extremely susceptible to their emotions and poor decision-making under a “buy-and-hope” style of investing. This is mitigated under an actively managed strategy that is focused on risk.
Imagine starting with $100,000 in 2006 and withdrawing $400 per month ($4,800 per year) regardless of the market. In the depths of the Great Recession, an investor owning the S&P and withdrawing $400 per month would have seen his $100,000 dwindle to $44,000 while an investor with a cash-managed strategy would have dipped to $83,000. By the time 2018 rolled around, the investor who adhered to a strategy that tracks the crossover of the 50-day and 200-day moving averages would have withdrawn $58,800 and would have an account value of $130,000. The investor owning the S&P 500 would have the same withdrawals but would have $110,000, almost 20% less in his or her account. Figure 4 highlights this.
FIGURE 4: MOVING-AVERAGE CROSSOVER STRATEGY VS. S&P 500 BUY AND HOLD
(WITH WITHDRAWALS)
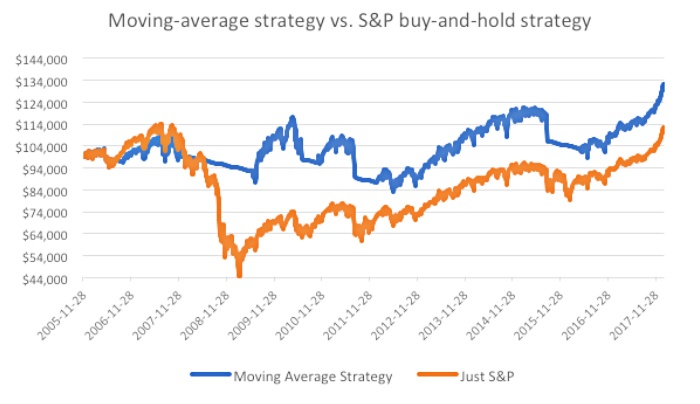
Source: W. Hubbard, CBOE market data
Market drawdowns negatively impact investors so severely when taking distributions that managing the downside and managing client expectations are two of the most important considerations for a financial advisor managing a client’s investment portfolio. Additionally, this discussion of risk management strongly underscores the important role that cash can play in helping clients achieve their long-term goals. Even for clients not taking distributions, the crossover-strategy example shows that though some performance might be sacrificed with a risk-managed strategy, the behavioral and emotional benefits of avoiding steep drawdowns arguably more than makes up for it.
Will historical drawdown levels occur again?
For years, we have been in a rampant bull market and investors have been extremely happy with returns—so happy that complacency appears to be setting in. Memories are becoming so short that it’s easy to forget how easily 30% to 50% of savings can be wiped out. Since 1942, investors have experienced a market drawdown greater than 5% about 34% of the time. From 2016 to early 2018, the time spent in drawdowns over 5% shrunk to 7% of the time. Looking back by decade, the last time investors experienced a drawdown less than 20% in a decade was in the bull market of the 1990s, which was soon followed by the dot-com bubble, the Great Recession, and the “lost decade.” Figure 5 shows the maximum drawdowns by decade from 1940 to the present day.
FIGURE 5: MARKET DRAWDOWNS BY DECADE (1940–PRESENT DAY)
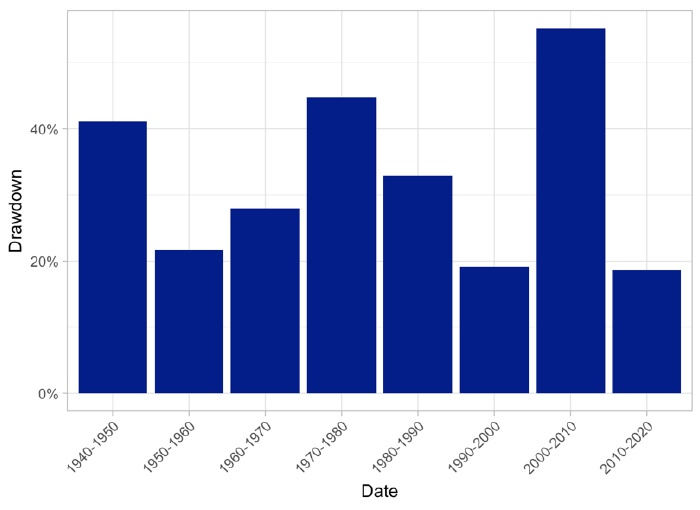
Source: W. Hubbard, FPI Research
Since the Great Recession, many investors have changed course, moving from active, risk-focused strategies to a more passive buy-and-hold style of investing via index funds. Drawdowns, just like auto accidents, happen, and they happen more often than investors realize. They’ve traded in full-coverage auto insurance policies in the hope that a severe accident never happens—and it has been working for several years. But perhaps now is the time to shop for insurance policies again. Active investment managers focus on protecting client assets and minimizing the impact of steep market drawdowns by using in-depth quantitative and qualitative research and strategies to address potential market pitfalls. Remember, accidents can happen in the blink of an eye.
The opinions expressed in this article are those of the author and do not necessarily represent the views of Proactive Advisor Magazine. These opinions are presented for educational purposes only.
The strategy mentioned in this article is an illustration of an actively managed risk strategy. It is not meant to be used as the foundation for client recommendations or as a foundation for research into actively managed risk strategies. It is simply for illustration and educational purposes.
 William Hubbard, CFA, is a quantitative money-management analyst. He has spent his career focusing on how active management can generate results regardless of market direction. He earned his bachelor’s degree in electrical engineering, with a minor in economics, from Oakland University.
Recent Posts: