Broader market resilience and top-performing sectors
Second-quarter earnings broadly exceeded expectations, with more than 80% of S&P 500 companies beating earnings-per-share (EPS) estimates, many by comfortable margins. The blended earnings growth for the index hovered around 11.9%, marking the third straight quarter of double-digit gains.
Revenue performance was solid as well, with many sectors seeing positive surprises. Health Care, Information Technology, Communication Services, Financials, and Consumer Discretionary all contributed notably to higher revenues and earnings revisions since late June. Despite tariff pressures, companies showed resilience by negotiating supply chain costs, passing on prices, and benefiting from a weaker U.S. dollar, which supported cross‑border revenues. Financials, in particular, experienced a strong upward revision in earnings growth—jumping from an original projected growth of 2.2% to 12.9% in recent weeks.
BlackRock highlighted the strength in its Q2 earnings analysis:
“82% of companies in the S&P 500 have beaten EPS estimates, relative to a post-pandemic average of 78%. That strength has been reflected in guidance momentum: nearly 60% of companies providing full-year guidance have raised it—almost double the rate in Q1.
“Earnings beats have been tolerated while misses have been punished. Top and bottom-line misses have been punished by an average sell-off of 10%, more than twice the historical decline. The skew is asymmetric: companies that beat expectations rose by just 1.5%, in line with historical averages. The lopsided reactions likely reflect the lower bar coming into the quarter.”
The ‘Magnificent 7’ and other big tech companies outperformed the rest of the S&P 500
The “Magnificent 7” (Apple, Alphabet, Amazon, Meta, Microsoft, Nvidia, and Tesla) delivered remarkable performance in Q2, with aggregate year‑over‑year earnings growing 26%, well ahead of consensus estimates. EPS came in around 10%–12% above expectations. This cohort accounted for a disproportionate share of the S&P 500’s earnings growth, with Nvidia, Amazon, Meta, and Microsoft among the top six contributors.
Performance, however, varied widely within the group. For example, Tesla underperformed significantly, while Nvidia soared in terms of earnings. Despite concerns about stretched valuations—with S&P tech and overall price-to-earnings ratios above historical averages—investor enthusiasm around AI-driven growth remains a strong tailwind.
However, RBC Wealth Management offered a note of caution for large tech going into 2026:
“Bloomberg Intelligence analysts recently pointed out a notable development within the Information Technology sector.
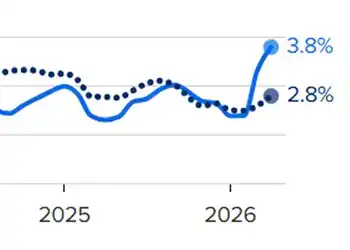
“Since late 2022, the Tech sector’s market capitalization (market value) as a proportion of the S&P 500’s total market cap has expanded meaningfully, from around 22 percent to over 32 percent.
“Yet at the same time, the Tech sector’s net income (net earnings or net profits) as a proportion of the S&P 500’s total net income hasn’t moved up much. It’s risen from 21 percent in late 2022 to 23 percent recently.
“The chart [Figure 1] illustrates that the gap between these Tech market cap and net income measures has widened substantially.
“To bring this relationship back to a more reasonable balance, Bloomberg Intelligence estimates that Tech sector earnings would need to grow substantially more than the already-elevated growth rates. Its analysts doubt this will pan out, especially given the difficult comparisons recently, and we agree with this assessment.”
FIGURE 1: INFORMATION TECHNOLOGY SECTOR AS A SHARE OF THE
S&P 500 (%)

Sources: RBC, Bloomberg Intelligence. Quarterly data through 6/30/25. “TTM” means trailing 12-months earnings.
![]() Related Article: How understanding technical analysis can benefit financial advisors
Related Article: How understanding technical analysis can benefit financial advisors
Divergent sector performance and the impact of tariffs
While Information Technology and Communication Services led Q2 gains, other sectors exhibited more mixed outcomes. Consumer Discretionary saw upsides from key players like Amazon and Ford, while Industrials lagged. Consumer Staples, Materials, and Energy all recorded year‑over‑year earnings declines so far. Health Care delivered solid revenue surprises, helping lift the S&P 500’s overall revenue growth. Overall, cyclical and consumer-exposed industries—particularly those impacted by tariffs—showed more subdued strength, highlighting pockets of vulnerability that contrast sharply with the robustness seen in big tech and Financials.
The Financial Times explored the impacts of tariffs on earnings results in mid-August:
“What then explains the US’s solid results? First, industries directly in the crosshairs of tariffs account for less than 17 per cent of S&P 500 earnings, estimates Deutsche Bank. Even so, the Q2 reports show that many affected organisations managed to protect their margins by adopting several mitigation strategies, ranging from cutting costs and building up inventories to raising prices and finding alternate suppliers. The breadth of responses limited the contagious impact of higher prices and lay-offs across domestic supply chains and, in turn, the wider economy. …
“The pain is set to worsen in the coming months. The bulk of Trump’s ‘reciprocal’ import duties were only implemented last week. Some businesses may hope that by establishing a baseline tariff rate, the uncertainty of ongoing bilateral negotiations is at least reduced. …”
Yahoo Finance added last month,
Highlights for Q2 2025 earnings to date
FactSet offered the following key metrics in its Aug. 29 Earnings Insight:
- “Earnings Scorecard: For Q2 2025 (with 98% of S&P 500 companies reporting actual results), 81% of S&P 500 companies have reported a positive EPS surprise and 81% of S&P 500 companies have reported a positive revenue surprise.
- “Earnings Growth: For Q2 2025, the blended (year-over-year) earnings growth rate for the S&P 500 is 11.9%. If 11.9% is the actual growth rate for the quarter, it will mark the third consecutive quarter of double-digit earnings growth for the index.
- “Earnings Revisions: On June 30, the estimated (year-over-year) earnings growth rate for the S&P 500 for Q2 2025 was 4.8%. Nine sectors are reporting (or have reported) higher earnings today (compared to June 30) due to positive EPS surprises.
- “Earnings Guidance: For Q3 2025, 46 S&P 500 companies have issued negative EPS guidance and 52 S&P 500 companies have issued positive EPS guidance.
- “Valuation: The forward 12-month P/E ratio for the S&P 500 is 22.4. This P/E ratio is above the 5-year average (19.9) and above the 10-year average (18.5).”
FactSet summarized in their overview for Q2,
FIGURE 2: S&P 500 CHANGE IN FORWARD 12-MONTH EPS VS.
CHANGE IN PRICE—10 YRS.

Source: FactSet
FIGURE 3: S&P 500 EARNINGS GROWTH BY SECTOR—Q2 2025 (Y/Y)

Source: FactSet
RECENT POSTS