Two very different outlooks for the S&P 500—Could both be right?
Two very different outlooks for the S&P 500—Could both be right?

Two highly regarded firms recently presented vastly different forecasts for the macro U.S. equity market.
Optimistic projection: S&P 500 at 15,000 by 2030
Tom Lee, managing partner and head of research at Fundstrat Global Advisors, predicts the S&P 500 could reach 15,000 by 2030. Here’s a closer look at Lee’s forecast and the key factors driving his expectations:
- Strong annual returns: Lee is expecting a 20% annual increase for the Index from now until 2030, with earnings growth contributing 12% to 15% of that total. He says this will be the third cycle in the U.S. markets where compounded large returns drive substantial Index growth.
- AI and productivity: Advancements in artificial intelligence (AI) could boost productivity, which would support economic growth and help control inflation. It could also enhance profit margins, which would support higher price-to-earnings (P/E) ratios. Lee points out that U.S. companies will lead the global AI workforce.
- Demographics: Millennials, now averaging around 31 years old, are entering their prime earning years (ages 30–50). This global cohort of 2.5 billion people is poised to fuel economic growth through increased spending and borrowing. (See charts supporting Lee’s assertions here.)
Cautious projection: S&P 500 returns of 3% annually
Goldman Sachs’ analysts, on the other hand, forecast the S&P 500 will return an average of just 3% a year in the next decade (8,000 on the S&P 500 by 2034). Key factors behind their analysis include the following:
- Market concentration: By Goldman Sachs’ measure, the market’s current concentration is near its highest level in 100 years. Concentration of this magnitude, the analysts say, makes the performance of the S&P 500 overly reliant on the earnings growth of its largest stocks. The 10 largest stocks in the S&P 500 currently account for about 36% of the Index, far higher than at any other time in the last 40 years. These stocks have grown their market caps substantially, in large part because of their exceptional earnings growth over the last two years.
- Earnings sustainability: Historically, it is difficult to sustain earnings growth of that magnitude and at that pace. A Goldman Sachs analysis found that only 11% of S&P 500 companies since 1980 have maintained double-digit sales growth for more than 10 years, and just 0.1% have sustained margins of more than 50% for a decade.
- Declining growth: The “Magnificent Seven” stocks have already seen a slowdown in earnings growth from their meteoric pace of the past two years.
Goldman also believes that the equal-weighted S&P 500 Index will outperform the market-cap-weighted version over the next decade as a result of the market’s concentration and slowing earnings growth for many of the current mega-cap market leaders.
Could both outlooks be right?
The U.S. equity market is in its 13th year of a secular bull market. In our 2012 book, “Dow 85,000! Aim Higher,” we forecast a 19- to 20-year secular bull ending in 2030. Tom Lee’s projection for the S&P 500 to hit 15,000 by 2030 aligns with this timeline. And the growth rate needed to achieve that goal is 16.5%, close to the 16.3% annualized return of the 1982–2000 secular bull market.
In our upcoming book, “Dow 85,000 and Beyond,” set to be released in Q1 2025, we explore many of the same fundamental drivers cited above—advancements in AI, increased productivity, and earnings growth—that support the continuation of the current secular bull market. We also examine what might lie beyond this period.
Secular bull markets are inevitably followed by secular bear markets. Unfortunately, there will be no clear signal to mark the end of the secular bull and the start of a new secular bear market.
The first confirmation of the start of a longer-term secular bear will be the depth of the initial shorter-term cyclical bear market. The cyclical bears within secular bull markets are often short (less than a year) and shallow (a decline of 20%–25%)—what we refer to as “teddy bears.” However, the first cyclical bear in a new secular bear is typically a “grizzly bear”—lasting years, with losses averaging 50%.
Here are some notable examples:
- 1929–1948 secular bear: The initial bear drop for the Dow was 47.9% in 1929, followed by a short rally and another 2.2-year bear market loss of 86.0%.
- 1968–1982 secular bear: This bear started with a 36.1% drop for the S&P 500 over 1.5 years, while the NASDAQ lost 50.9% over 1.7 years.
- 2000–2011 secular bear: This bear began with a 55.7% loss for the S&P 500 lasting 2.5 years. The NASDAQ lost more than 78.0% over the same period.
![]() Related Article: How does today’s stock market compare to the 2000 tech bubble?
Related Article: How does today’s stock market compare to the 2000 tech bubble?
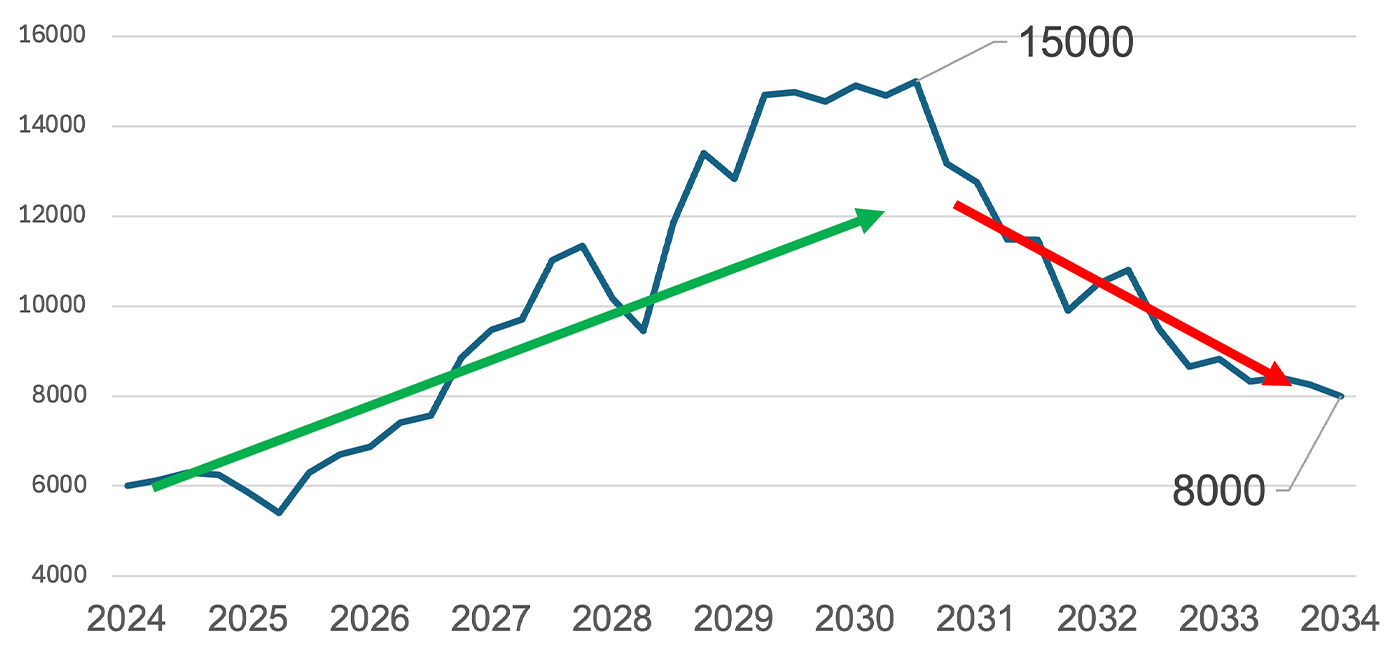
Here is how both S&P 500 outlooks could be right: Tom Lee’s projection for another 150% move in the S&P 500 carries it to 15,000 by 2030. That marks the peak in the 2011–2030 secular bull market. That could precede a three-year cyclical bear market drop of 47%, marking the beginning of a new secular bear market, and pulling the S&P 500 down to 8,000. This would meet Goldman Sachs’ estimate of a “lost decade” (2024–2034) of subpar 3% S&P 500 annual returns.
SCENARIO WHERE BOTH S&P 500 OUTLOOKS WORK: THE SECULAR BULL ENDS IN 2030 AND THE FIRST CYCLICAL BEAR IN A NEW SECULAR BEAR BEGINS

Source: STIR Research
How to profit from both outlooks
Ray Dalio, founder of Bridgewater Associates, advises, “If you are not aggressive, you are not going to make money, and if you are not defensive, you are not going to keep money.”
Be active and tactical. Take full advantage of the 150% run over the next six years by owning the leaders (asset classes and/or sectors) and increasing your market exposure. Be aggressive and magnify the potential returns with leverage as appropriate. Avoid the single-digit returns of bonds when double-digit equity returns should be the norm.
With a risk-management strategy in place, you should be able to hang on to the majority of those gains. The “buy and hope” strategy will disappoint again. That will lead to an uncomfortable roller-coaster ride, ending with subpar returns and likely steep portfolio drawdowns.
The opinions expressed in this article are those of the author and the sources cited and do not necessarily represent the views of Proactive Advisor Magazine. This material is presented for educational purposes only.
 Marshall Schield is the chief strategist for STIR Research LLC, a publisher of active allocation indexes and asset class/sector research for financial advisors and institutional investors. Mr. Schield has been an active strategist for four decades and his accomplishments have achieved national recognition from a variety of sources, including Barron's and Lipper Analytical Services. stirresearch.com
RECENT POSTS


