Post-election market moves were supported by bullish technical indicators
Post-election market moves were supported by bullish technical indicators

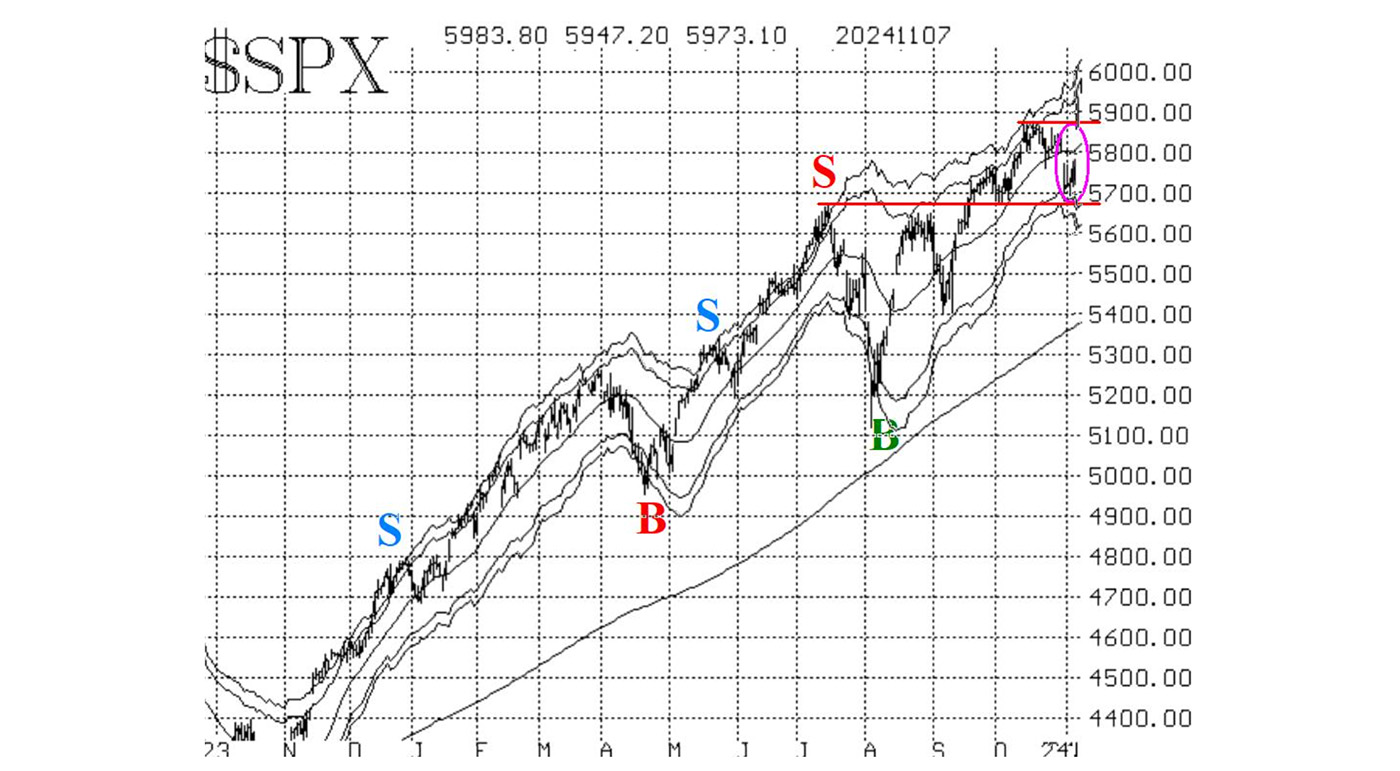
The presidential election victory by former President Donald Trump proved to be a very positive catalyst for stocks. $SPX gapped to a new all-time high on the next trading day after the election, as did many other broad-based indexes. Since there is no formal overhead resistance, the target for this move is the +4å “modified Bollinger Band” (mBB), which is currently at 6,030 and rising daily. (Editor’s note: Mr. McMillan’s analysis was first posted on Nov. 8, 2024.)
FIGURE 1: S&P 500 (SPX) ONE-YEAR TREND

Source: McMillan Analysis Corp.
There is now support at the old highs, in the area of 5,870. Because the market was in a trading range for some time before the election, the entire zone between 5,670 and 5,870 can technically be considered support. However, a close back below 5,870 would be negative psychologically and would cause us to relinquish our “core” bullish position. As it stands now, though, that “core” bullish position is still intact.
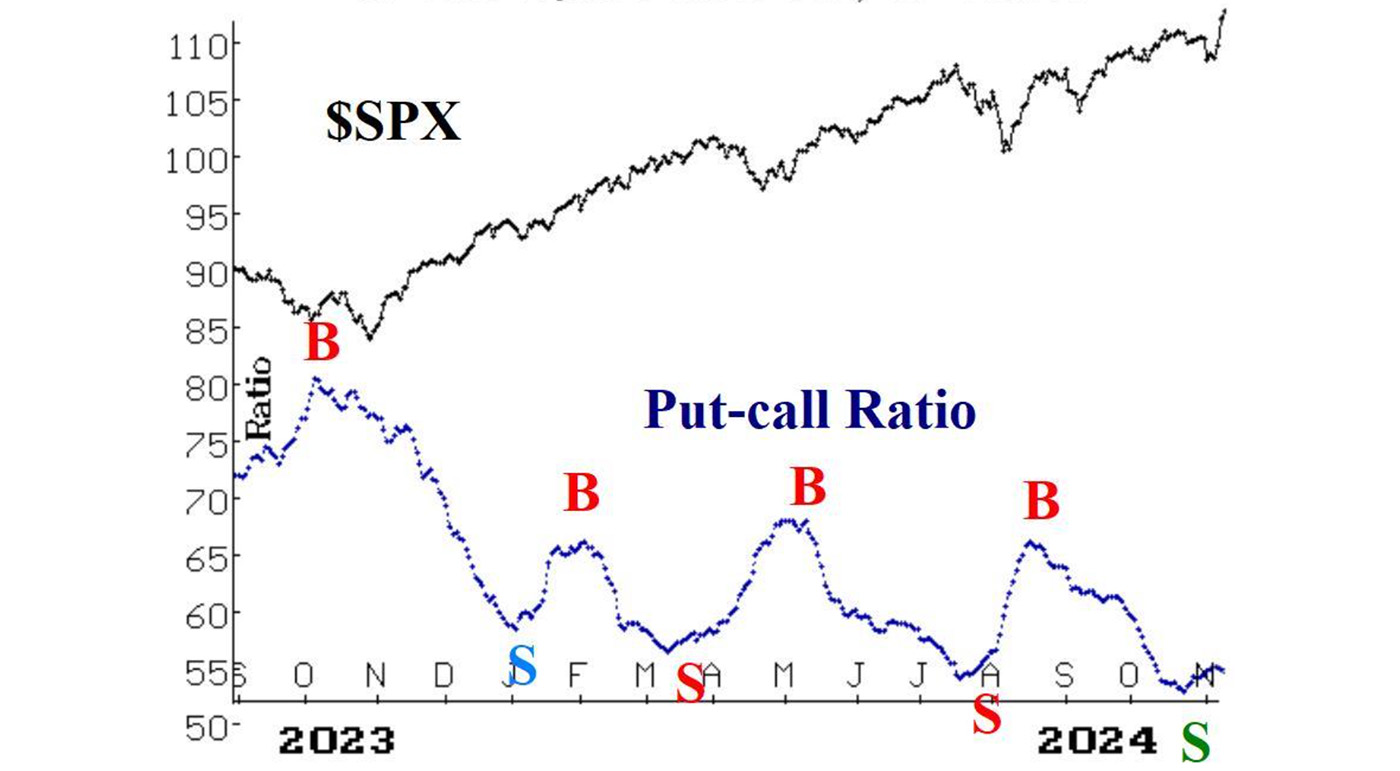
Equity-only put-call ratios remain on sell signals, despite the positive nature of things since the election. You can see from Figure 2 that the ratio has moved sideways for the past couple of days, but the computer programs that we use to analyze these charts continue to expect the ratios to move higher again, thus they remain on sell signals. They are not that far above their recent October lows, and a move back below those October lows would cancel out the sell signals.
FIGURE 2: 21-DAY EQUITY-ONLY PUT-CALL RATIO

Source: McMillan Analysis Corp.
Breadth, on the other hand, has responded very positively to the election results and was even turning positive before the election. The breadth oscillator sell signals, which were fairly accurate but extremely short-lived, have been reversed to buy signals now.
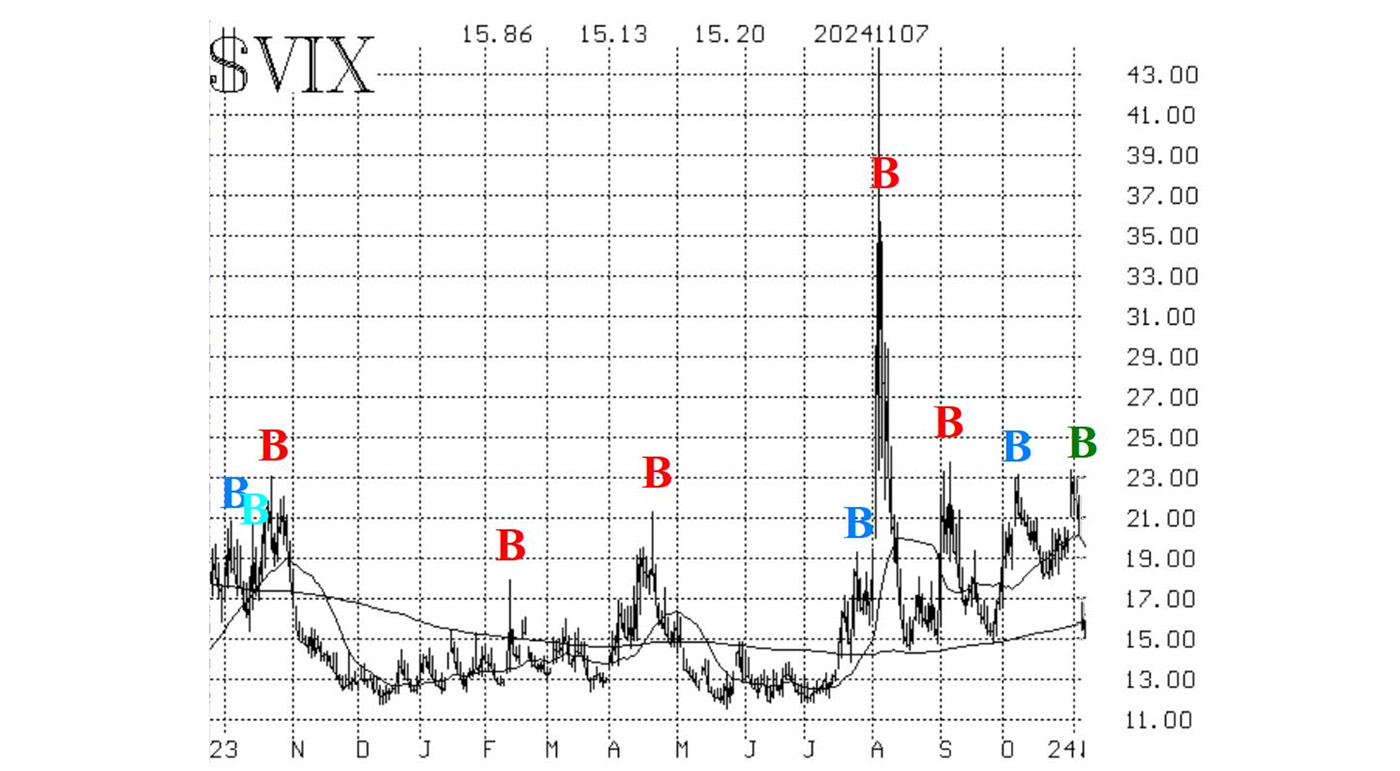
The entire volatility space has been altered in the wake of the election—something that was to be expected, since the options expiring just after the election were inflated because of that event. $VIX gapped down sharply, and that confirmed a new “spike peak” buy signal as of the close of trading on Nov. 6.
In addition, $VIX has now closed below its 200-day moving average for the first time since last July. If it does so again today, that would finally terminate the errant trend of the $VIX sell signal that has been in place this whole time.
![]() Related Article: An interesting footnote to ‘Sell in May and go away’
Related Article: An interesting footnote to ‘Sell in May and go away’
FIGURE 3: CBOE VOLATILITY INDEX (VIX) GAPS DOWN FOLLOWING ELECTION

Source: McMillan Analysis Corp.
We are maintaining a “core” bullish position, as long as $SPX continues to close above 5,870. We will trade other confirmed signals around that “core.” Also, deeply in-the-money calls should be rolled upward.
Editor’s note: Mr. McMillan updated his market commentary on Nov. 18 as follows:
Stocks have struggled a little this week [week ending Nov. 15], after roaring higher post-election. On the $SPX chart, there is resistance in the 6,010-6,020 area, where prices peaked on four separate days in the past week. That is minor resistance. The upside target for this move still remains as the +4å “modified Bollinger Band” (Mbb), which is now nearing 6,070 and still rising.
There is support at 5,870, the previous high, and as long as that holds, the bulls will remain in charge. A two-day close below 5,870 would cause us to abandon our “core” bullish position, but the market could still recover from that fairly easily. However, a close below 5,670 would be a major problem, for it would not only negate the positive “island reversal” pattern on the $SPX chart but would be a decline below several important support areas.
The opinions expressed in this article are those of the author and the sources cited and do not necessarily represent the views of Proactive Advisor Magazine. This material is presented for educational purposes only.
This is an edited version of an article that was first published at optionstrategist.com on Nov. 8, 2024.
 Professional trader Lawrence G. McMillan is perhaps best known as the author of “Options as a Strategic Investment,” the best-selling work on stock and index options strategies, which has sold over 350,000 copies. An active trader of his own account, he also manages option-oriented accounts for clients. As president of McMillan Analysis Corporation, he edits and does research for the firm’s newsletter publications. optionstrategist.com
RECENT POSTS


