Physical gold has built on its steady rally—which began in October 2022—throughout 2024. During that period, gold’s continuous futures contract has gained over 60%.
FIGURE 1: GOLD CONTINUOUS CONTRACT—LAST 3 YEARS

Source: MarketWatch, data as of 10.7.2024
Seeking Alpha noted the following about gold’s performance last week:
“Gold futures eased on Monday but finished Q3 with the strongest quarter since Q1 2016 in a historic rally driven by optimism over the potential for further U.S. interest rate cuts and demand for safe-haven assets due to heightened Middle East tensions.
“Meanwhile, optimism over the economic backdrop is improving, with China’s central bank announcing new stimulus measures over the weekend to support the struggling property sector following surprisingly aggressive monetary policy measures unveiled last week, and the latest U.S. data showed the economy bounced back from the COVID-19 pandemic in stronger shape than previously thought.
“Front-month Comex gold for October delivery (XAUUSD:CUR) racked up a 13.2% gain for the quarter to $2,636.10/oz, its fourth consecutive quarterly gain during which the yellow metal surged more than 42%. …
“For September, gold gained 5.7% in the metal’s best one month percentage gain since March.”
Seeking Alpha explained another important factor driving the demand for gold:
“Gold has surpassed the euro to become the second-largest reserve asset after the U.S. dollar, according to Bank of America, with Seeking Alpha analyst Dave Kranzler adding that demand is enjoying a boost from the BRIC/eastern hemisphere alliance of countries.
“‘Gold now represents 16% of global bank reserves,’ Kranzler writes. ‘The dollar represents ~58% of central bank reserves, down from over 70% since 2002.’”
MarketWatch offers additional perspective on gold’s run higher:
“But gold has recently being [been] recording record highs. Strategists at JPMorgan led by Nikolaos Panigirtzoglou say gold has gone well beyond moves implied by dollar and real bond yield shifts. Instead, it has been driven by what’s called the debasement trade.
“‘The “debasement trade” is a term that reflects a combination of gold demand factors which in our client conversations range from structurally higher geopolitical uncertainty since 2022, to persistent high uncertainty about the longer-term inflation backdrop, to concerns about “debt debasement” due to persistently high government deficits across major economies, to waning confidence in fiat currencies in certain emerging markets, and to a broader diversification away from the dollar,’ the strategists say.
“These are all views, it should be said, that have been expressed for years—but gold around $2,700 an ounce and bitcoin around $60,000 give them new currency, so to speak.”
How are traders currently positioned in gold?
Bespoke Investment Group published the following analysis of gold from a historical perspective toward the end of Q3 2024:
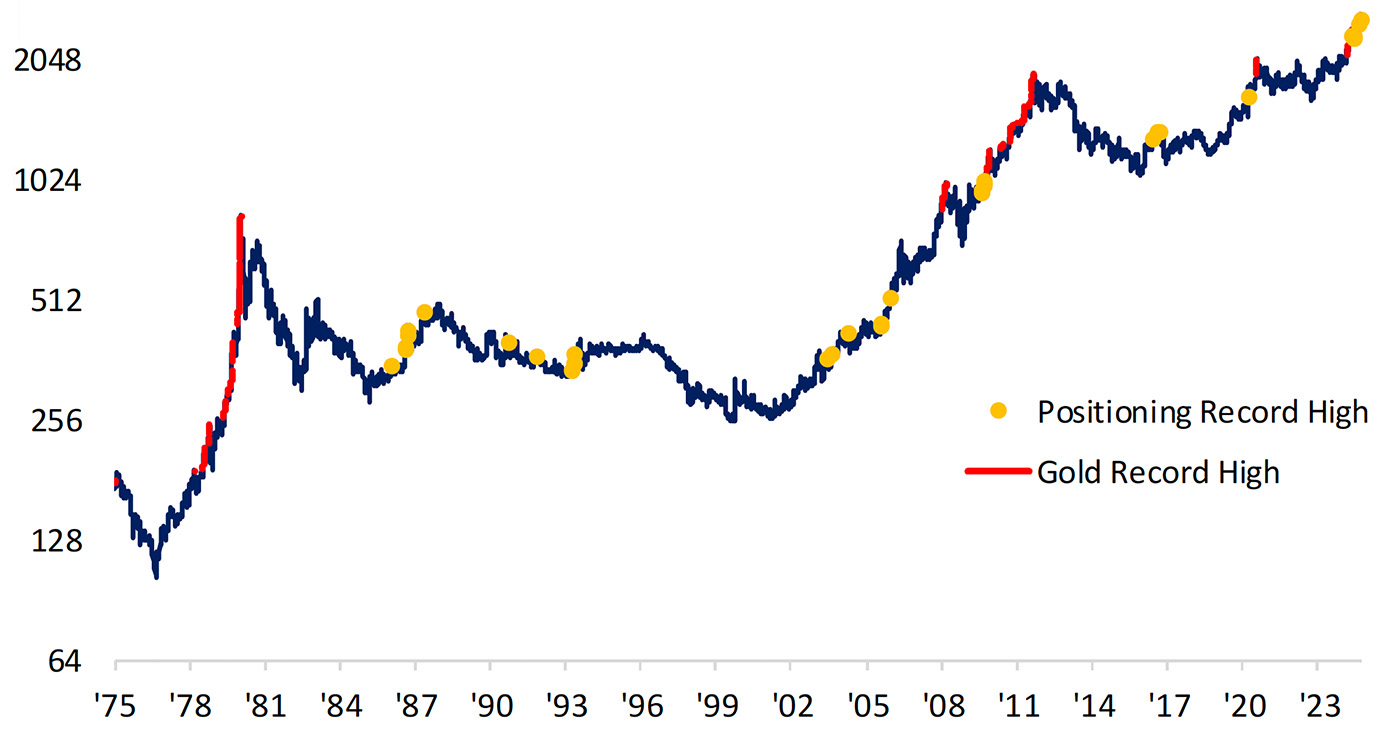
“Gold has been glittering. Through Thursday [9/26], front month gold futures hit six record closing highs in a row. Earlier this year, there was a similar streak that came to an end at seven days long in March, but looking back further there have only been seven other periods when gold has hit as lengthy of a streak of consecutive record closes: those occurrences are lumped in 1979 to 1980 in addition to November 2009, September 2010, and April 2011.
“Looking at gold from a long-term perspective. All time highs on their own have been relatively rare. Since 1976, it has closed at a record only 2% of the time, and again, those are mostly concentrated within a couple of periods. After consistent record highs through the late 1970s and early 1980s, gold didn’t see another record for over a quarter century. It wasn’t until the financial crisis and the Fed instituted its zero-interest rate policy that gold broke out above its 1980 peak. COVID provided another record, but until the end of 2023 and this current breakout, the metal was largely rangebound. This year, the pace of new highs have been heavy with 38. Put another way, 14% of record closing highs for gold have occurred this year. …”
![]() Related Article: How gold can help in creating a more optimal portfolio allocation
Related Article: How gold can help in creating a more optimal portfolio allocation
Bespoke also notes that the positioning in gold as measured by the CFTC’s Commitments of Traders report has been historically bullish:
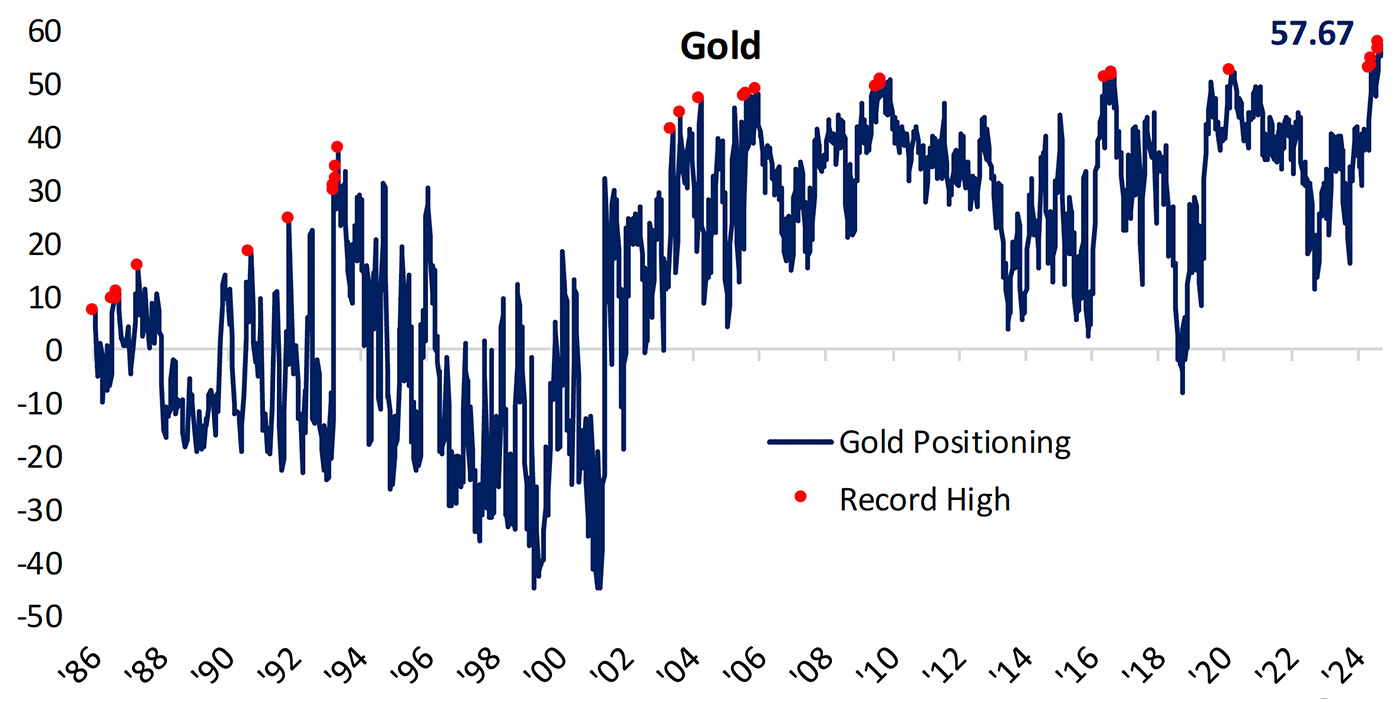
“Last week’s data as of last Tuesday saw a number of big moves in commodity futures, but some of the most notable were in the precious metals space. For starters, silver rose to 41.5% net long. That made for the most optimistic positioning since April 2017. Then there was gold which traders have gotten extremely long at 57.7% [Figure 2], which is—like the price of gold—a record high in this series dating back to 1986! This week’s data released Friday afternoon, saw a modest pullback to 55.9% net long.
“As shown in the chart at left [Figure 3], it hasn’t been particularly common for positioning highs to coincide with highs in price. Regardless, the metal has usually been trending higher when positioning hits records. That was also the case in the 1980s, albeit that was early on in the CFTC data’s history, and as such, back then the net long readings were significantly lower than they are now. The 1990s were a bit different as the strong reads on positioning came at a time when gold was sitting in a downtrend.”
FIGURE 2: COMMITMENTS OF TRADERS: SPECULATOR NET POSITIONING (% OF OPEN INTEREST)

Source: Bespoke Investment Group, data through 9.27.2024
FIGURE 3: FRONT-MONTH GOLD FUTURES SINCE 1986 (LOG SCALE)

Source: Bespoke Investment Group, data through 9.27.2024
RECENT POSTS


