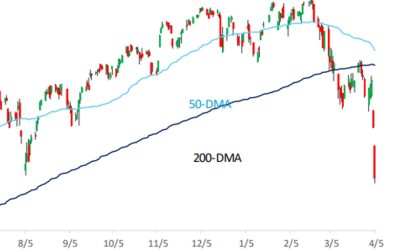
Last week brought positive news on inflation, but it was not enough to prevent the S&P 500’s weekly loss of 0.74%. This marked its fourth consecutive weekly drop—a trend not seen since the end of 2022. The threat of a government shutdown undoubtedly suppressed stock index performance going into this past weekend.
Nerad + Deppe Wealth Management wrote in its weekly recap,
“In terms of weekly closing prices, the S&P 500’s four-week losing streak has only shed -5.04%, but it does feel like -15.04%. The index recorded its monthly high for September on September 1 and then proceeded to decline 11 of the last 19 trading days, losing ~300 handles from peak to trough in the process. As the great Helene Meisler said, there’s ‘nothing like price to change sentiment,’ and the pullback the last two months has brought about a refresh in fear.”
FIGURE 1: MAJOR STOCK INDEXES SLIDE IN THE THIRD QUARTER
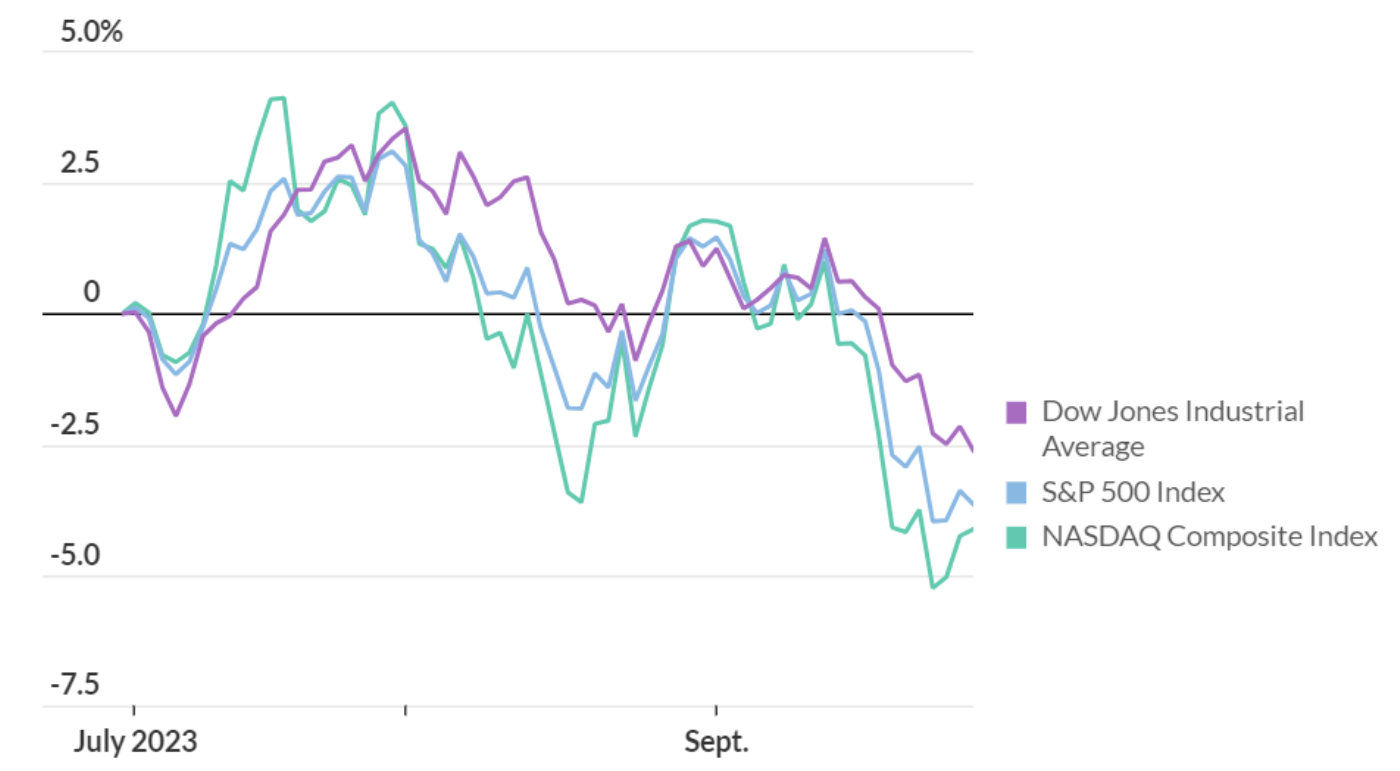
Sources: MarketWatch, FactSet
Reuters commented on the recent inflation data,
“Underlying U.S. inflation moderated in August, with the annual rise in prices excluding food and energy falling below 4.0% for the first time in more than two years, welcome news for the Federal Reserve as it ponders the monetary policy outlook.
“The battle against inflation is, however, far from being won as the report from the Commerce Department on Friday showed overall prices were still elevated, partly due to higher gasoline prices. …
“The personal consumption expenditures (PCE) price index, excluding the volatile food and energy components, edged up 0.1% last month. That was the smallest rise since November 2020 and followed a 0.2% advance in July. Economists polled by Reuters had forecast the core PCE price index would climb 0.2%.
“In the 12 months through August, the so-called core PCE price index increased 3.9%. It was the first time since June 2021 that the annual core PCE price index was below 4.0%. The core PCE price index rose 4.3% in July. …
“‘Getting (the) year-over-year (core) number below 4% could be a big psychological victory for the bulls and help keep a lid on the 10-year yield,’ said David Russell, global head of market strategy at TradeStation.”
FIGURE 2: TRENDS IN INFLATION MEASURES
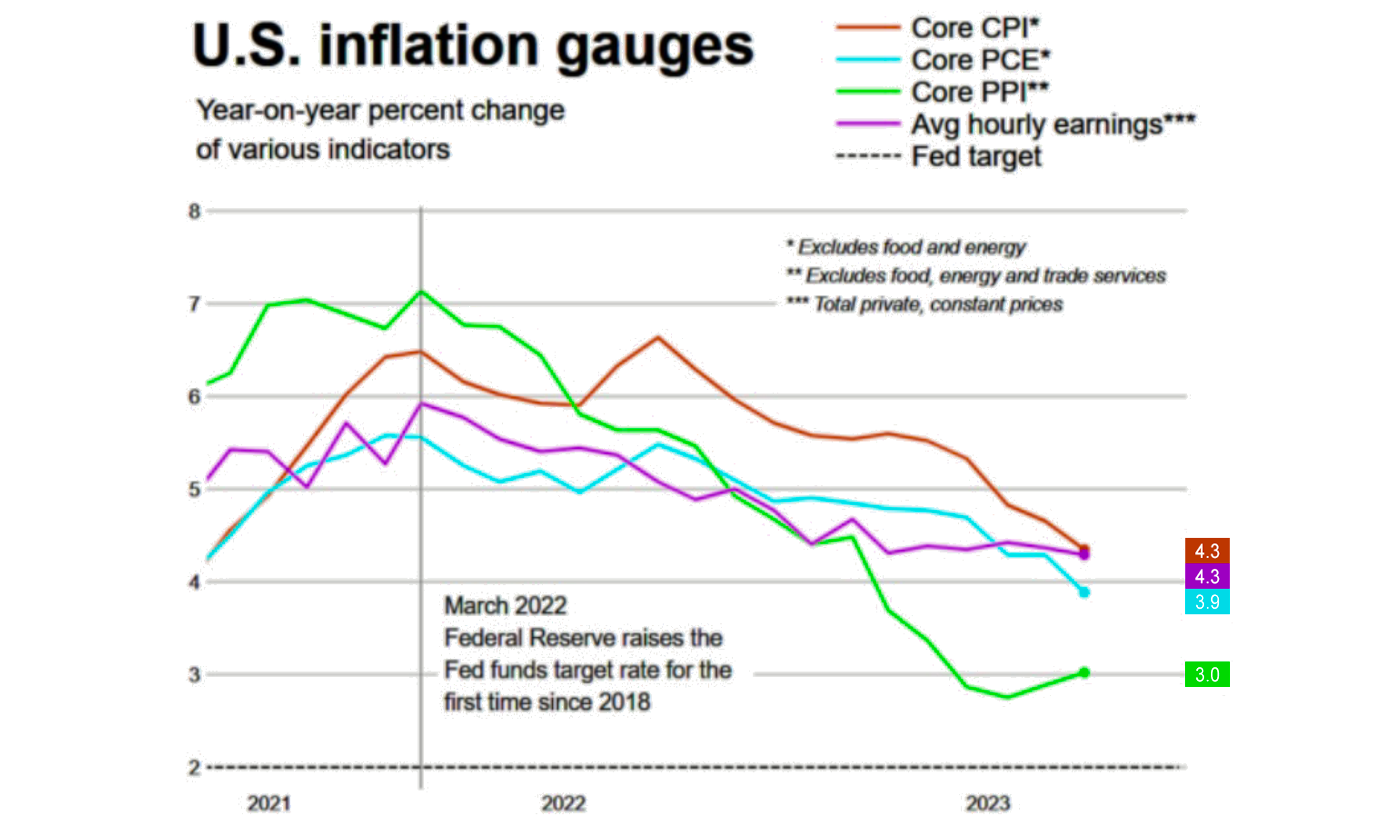
Sources: Reuters, LSEG DataStream
Reuters also noted that consumers are slowly seeing some future improvement on the inflation front, according to the most recent data from the University of Michigan: “ … Consumers’ 12-month inflation expectations fell to 3.2% this month, the lowest since March 2021, from 3.5% in August. Consumers’ long-run inflation expectations slipped to 2.8% from 3.0% last month.”
FIGURE 3: UNIVERSITY OF MICHIGAN—CONSUMER INFLATION EXPECTATIONS
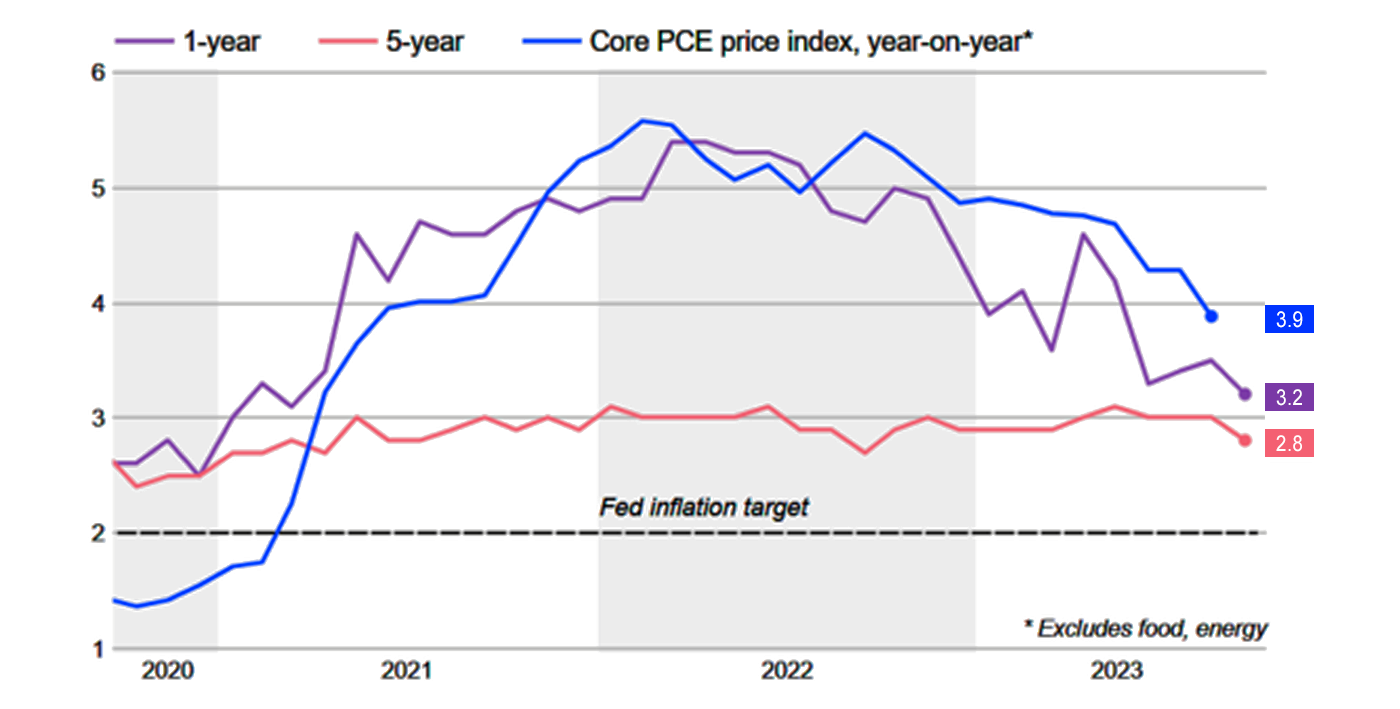
Sources: Reuters, LSEG DataStream, University of Michigan
The prices of many commodities have seen an upward trend
Home heating oil and gasoline prices at the pump—along with food prices—are often at the heart of many households’ concerns about inflation. But there was little good news in this regard last week—making the September decline in consumers’ future inflation perceptions somewhat surprising.
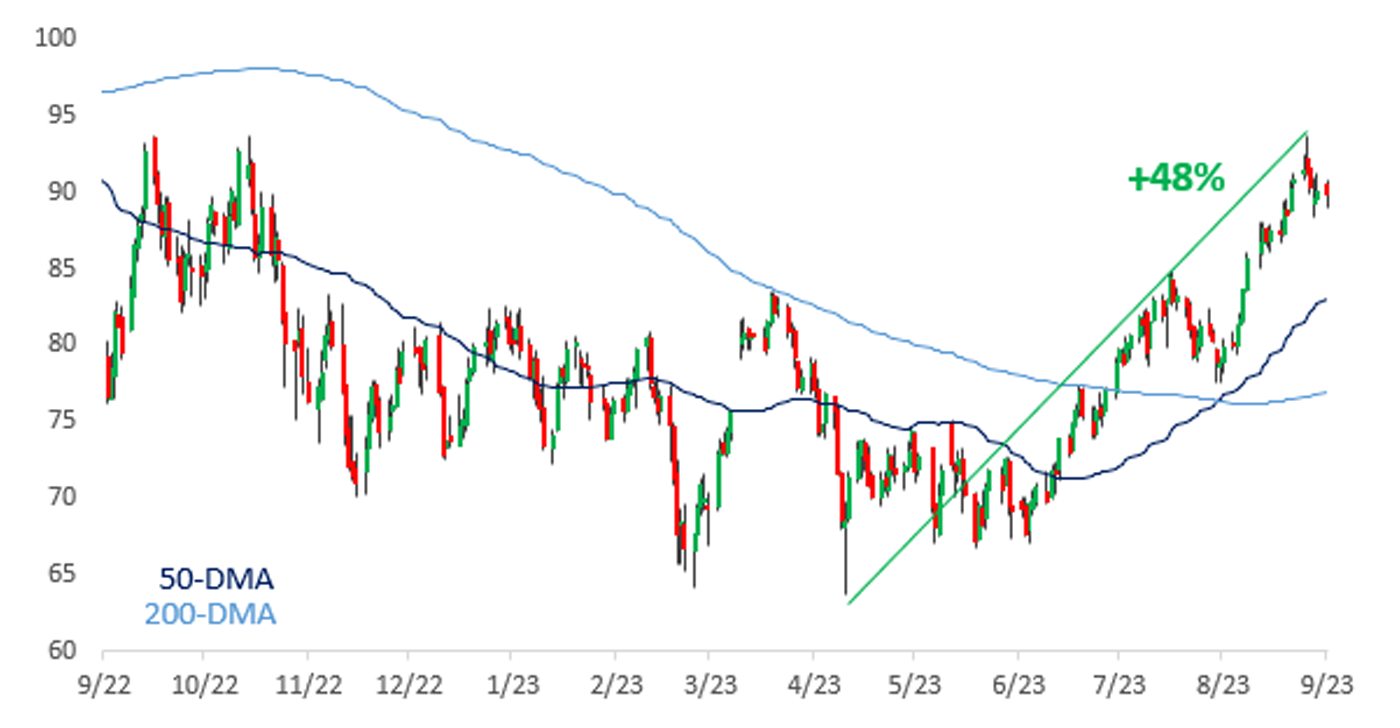
Bespoke Investment Group reported on the recent trend in the price of oil, “Last week, WTI topped out at $93.74 before pulling back modestly in the last week. At its high last week, though, crude oil had rallied 48% since its intraday low in early May.”
FIGURE 4: PRICE OF WTI CRUDE OIL—LAST 12 MONTHS
Source: Bespoke Investment Group
CNBC says many “soft” commodities that affect food prices are also marching higher in price:
“Surging prices for soft commodities, from orange juice to live cattle, are complicating the inflation picture.
“A host of agricultural commodities have climbed in recent months, driven by weather-related damage and rising climate risks around the globe, resulting in tighter supplies. The higher prices add another layer of pain to consumers’ wallets. …
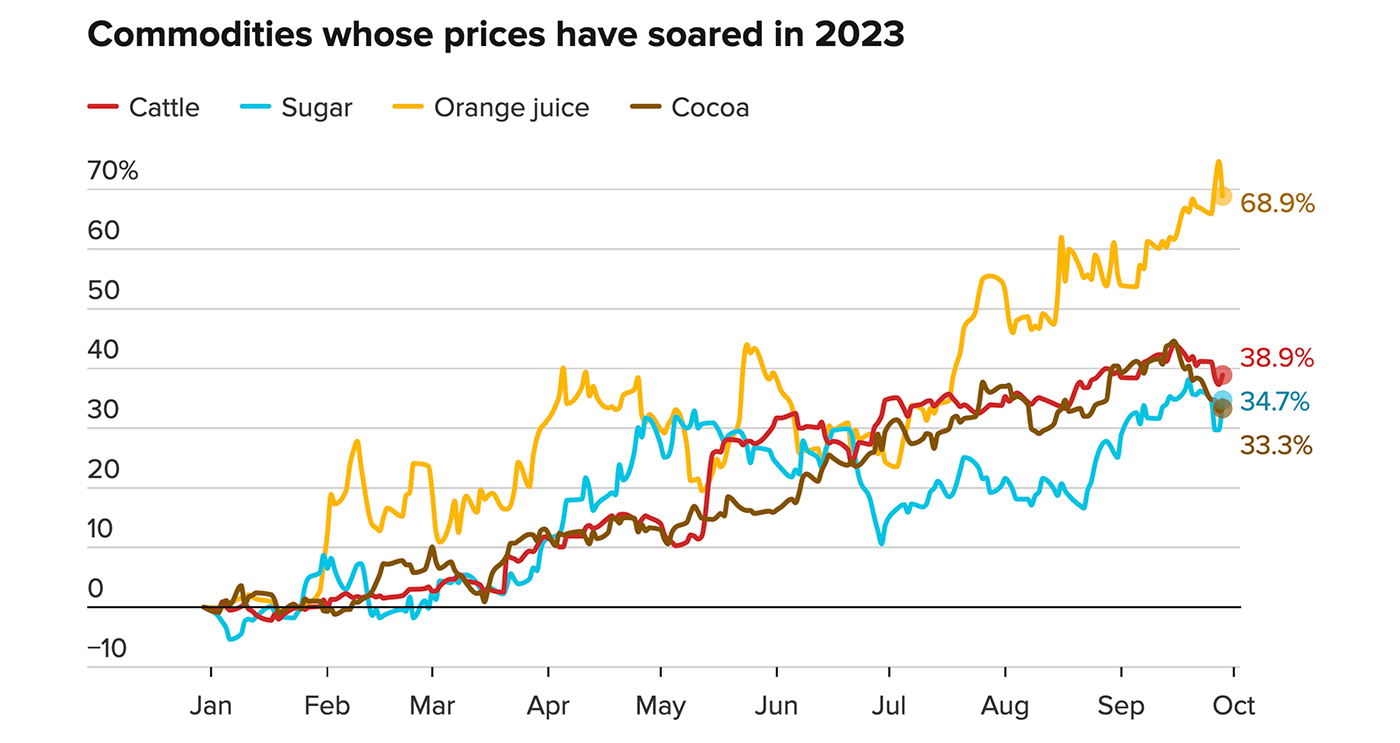
“Futures contracts on orange juice, live cattle, raw sugar and cocoa each hit their highs for the year this month. All are in ‘supply-driven bull markets right now,’ said Paul Caruso, director of commodity investments at Ancora.
“The S&P GSCI Softs index, a sub-index of the S&P GSCI commodities index that measures only soft commodities, has jumped more than 18% so far this year.”
FIGURE 5: SOARING PRICES FOR MANY SOFT COMMODITIES IN 2023
Source: CNBC analysis of FactSet data; prices as of Sept. 28, 2023
CNBC discussed the disconnect between rising commodity costs in many categories and the perception that the fight to control inflation is generally seeing positive results. CNBC also highlighted recent remarks from Grame David Pitkethly, Unilever’s chief financial officer, who observed, “We’ve got lots and lots of inflation and pricing … the consumer feels that pricing.”
CNBC added,
“‘Soft commodities in particular are very fragile and very sensitive to weather change,’ which can disrupt production, said Darwei Kung, head of commodities and natural resources at DWS. ‘That’s why we’re seeing the price go up, and there’s no short term solution because there’s only so much people can produce. And that’s not sensitive to demand as much as it is to the production side.’
“Given that food and energy are not included in calculations of core inflation, Kung added that consumers may experience higher daily prices than are taken into account by central bank policymakers. That could create a ‘bifurcation’ of perspectives around inflation that’s tougher on consumers, at least in the short-term, he said.”
It should be noted that not all soft commodities are rising in price. Corn, wheat, and soybean prices have declined significantly since 2023 highs earlier in the year—down 27.9%, 26.8%, and 14.6%, respectively.
The opinions expressed in this article are those of the author and the sources cited and do not necessarily represent the views of Proactive Advisor Magazine. This material is presented for educational purposes only.
RECENT POSTS

