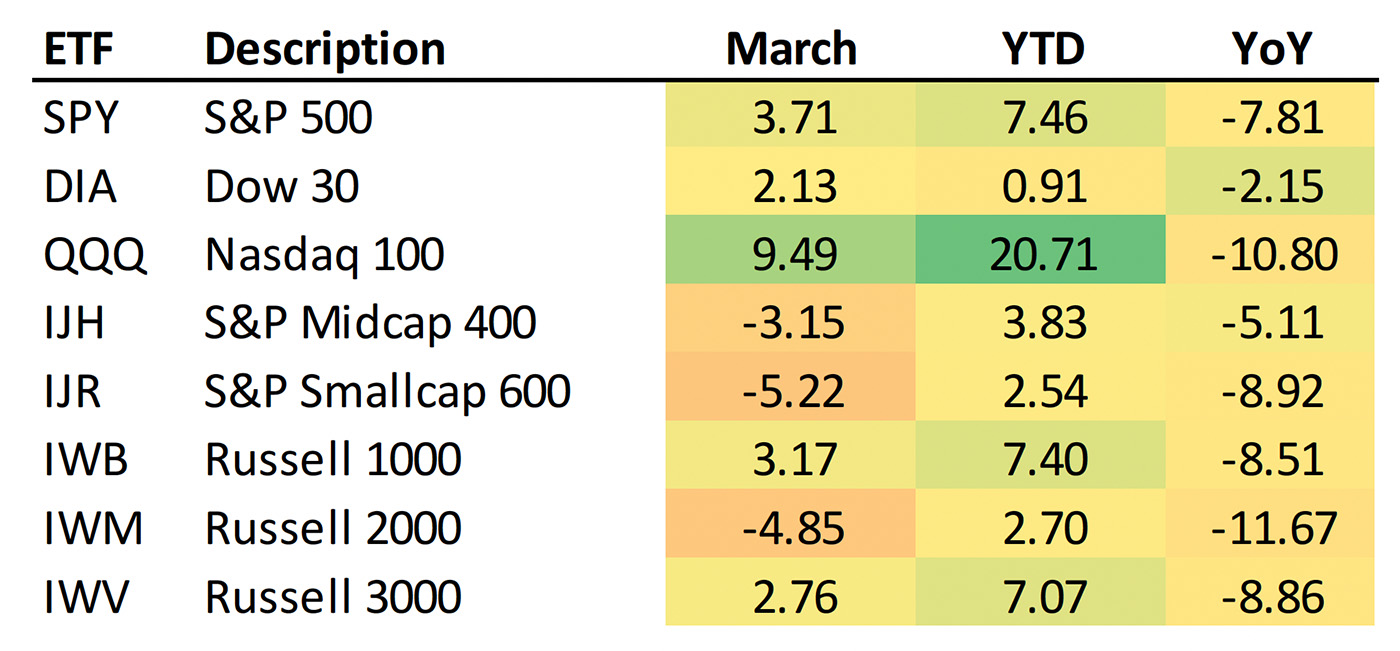
Most of the major market indexes closed out a positive Q1 with a strong March performance, led by the NASDAQ 100. As can be seen in Table 1, larger-cap stocks dominated in terms of Q1 gains. Mid-cap and small-cap stocks lagged, turning in a negative March.
TABLE 1: 2023 INDEX PERFORMANCE FOR MARCH, Q1, AND
YEAR OVER YEAR

Source: Bespoke Investment Group
Bespoke Investment Group summarized Q1 as follows:
“A 9.5% gain in March left the Nasdaq 100 (QQQ) up 20.7% in Q1. Remember, the Nasdaq fell 33% in 2022, so even with the big gains in Q1, the index is still down more than 10% YoY.
“The S&P (SPY) was up a much more modest 3.7% in March, while the Dow (DIA) was up even less at 2%. Mid-caps (IJH) and small-caps (IJR) were down 3-5% in March, so not everything rallied. The pain in small and mid-caps was due to the weakness in Financials and Energy, which have bigger weightings in the smaller-cap indices.
“The Financial sector ETF (XLF) was down 9.55% in March as bank failures popped up. Bank failures? They didn’t matter when it came to the rest of the market as sectors like Tech and Communication Services gained 8-10%. Investors seem to like the prospect of lower rates and the end of the Fed’s tightening cycle more than they dislike bank runs.”
Recent “Review & Preview” commentary from Barron’s highlights the fact that a relatively small number of stocks have been contributing heavily to market gains so far in 2023:
“Stocks have been resilient this year, though my Review & Preview colleague Nicholas Jasinski points out the market’s strength has been driven by a few big stocks, which can be a sign of a shaky rally. The average stock was recently up just 1% despite the S&P 500’s 7% run on the year. Nick writes:
“‘The market capitalization-weighted index’s overall rise is thanks to a handful of megacap companies at the very top: The 20 largest companies in the S&P 500 have added nearly $2 trillion in market cap this year, versus $170 billion for the remaining 480 stocks, notes Torsten Slok, chief economist at Apollo Global Management.’
“Nick notes that a top-heavy run can’t last forever. Investors will look for signs of broader rally participation when markets return from the holiday break. …”
Charlie Bilello, chief market strategist at Creative Planning, says in his weekly commentary,
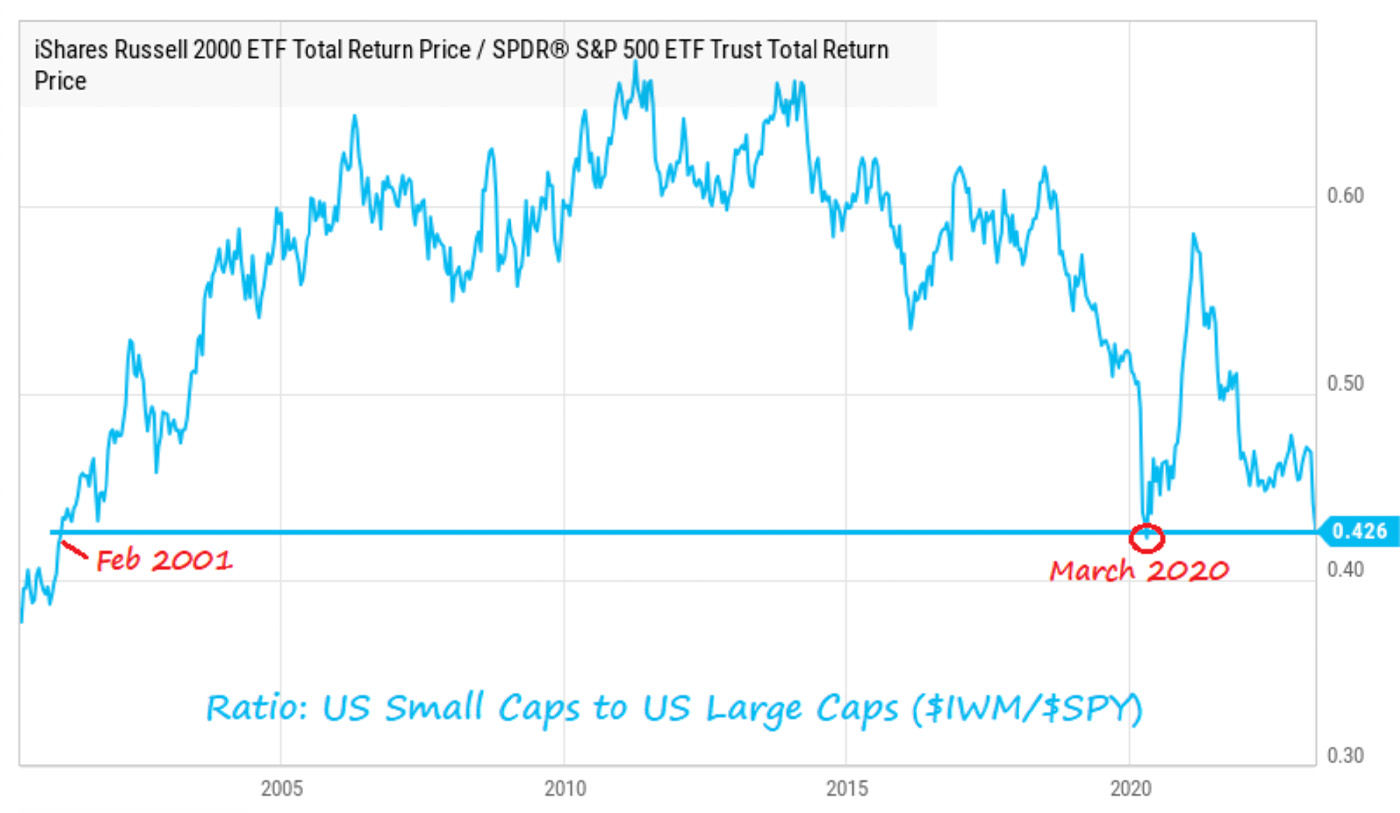
“The ratio of U.S. small caps to U.S. large caps is nearing March 2020 levels, which was the lowest we’ve seen since February 2001. Over the last 10 years small caps have gained 115% (8% annualized) vs. 214% for large caps (12% annualized).”
FIGURE 1: TOTAL RETURN RATIO OF RUSSELL 2000 TO S&P 500

Sources: Charlie Bilello, YCharts
Technical perspective on current market divergences
Market analyst and technician Tom McClellan provides further perspective on the contrast in performance between mega-caps and the broader market. McClellan wrote on April 6,
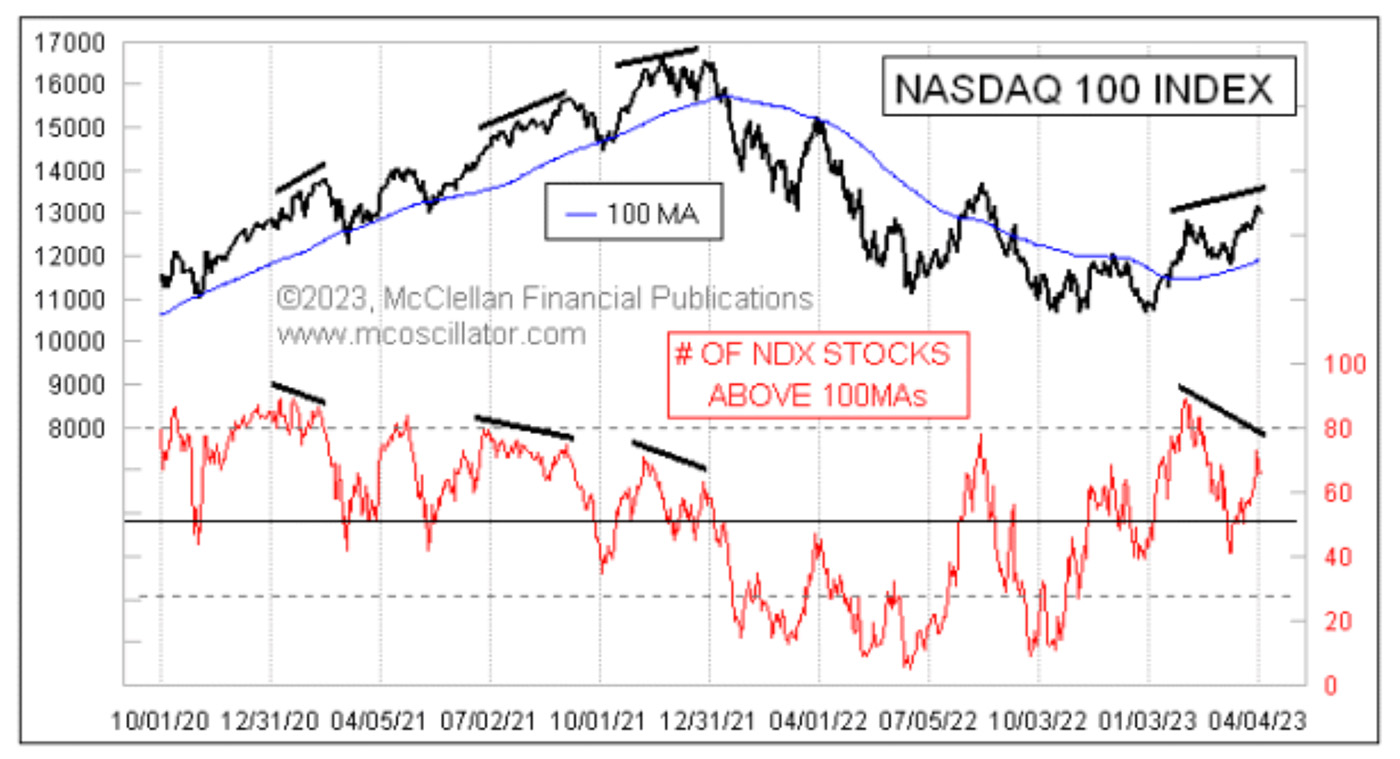
“The big tech darlings like Microsoft and Apple have a big weighting in the S&P 500 and in the Nasdaq 100 (NDX), and their recent strength has pulled the NDX up to a higher high. But we are not seeing confirmation of that in this week’s chart.
“This week’s chart shows an indicator that I feature numerically every day in my Daily Edition. It depicts the number of stocks in the Nasdaq 100 that are currently above their own 100-day simple moving averages.”
FIGURE 2: NOT ALL NASDAQ 100 STOCKS ARE JOINING THE PARTY

Source: McClellan Financial Publications
McClellan adds,
“Right now it [Figure 1] is showing a lower reading than the 83 it posted on Feb. 13. For now that is an apparent divergence versus the higher price high. Any current divergence must be characterized as an apparent divergence until well after the fact, because sometimes a divergence can get rehabilitated. If stock prices keep rallying, and if the rest of the NDX components all start climbing up above their 100MAs [moving averages], then the divergence could go away.
“I also like to always caution readers that any divergence is a ‘condition,’ not a ‘signal.’ The stock market does not have a mandate to go lower just because we notice this divergence (or any other). But it does work out that way a lot of the time, and the message here is that the rest of the components are not participating in the rally as much as the big-cap stocks that drive the price index. Uptrends are stronger when they are broad, and they are problematic when led by just a handful of stocks.”
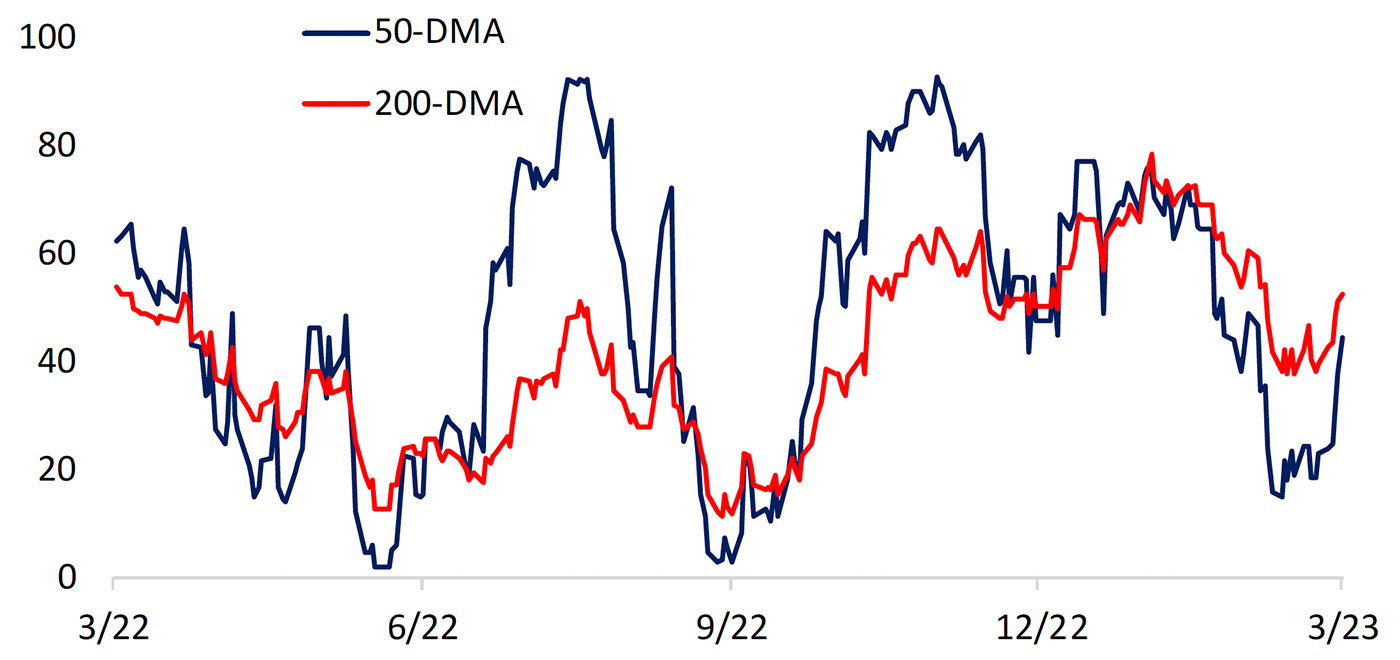
In terms of the broader S&P 500, Bespoke Investment Group said market internals at the end of March “shifted from bullish to neutral,” adding,
“While not negative, things like high yield spreads and the percentage of stocks above their 50-DMAs [50-day moving averages] and 200-DMAs are simply keeping up with the move in prices. While the S&P is up solidly year-to-date … only three of eleven sectors were up on the year. That’s not the type of breadth you typically see when describing a healthy rally.”
FIGURE 3: S&P 500 % OF STOCKS ABOVE 50- AND 200-DMAS

Source: Bespoke Investment Group
New this week:
