
The “Oracle of Omaha,” Warren Buffett, has been warning investors about bonds for the past decade:
- “Right now bonds should come with a warning label.”—2011 Berkshire Hathaway shareholder letter
- While the safety of investments in things like bonds are often lauded, he has suggested “they are among the most dangerous of assets.”—Adaptation of the same annual letter that appeared on Fortune magazine’s website
- “If I had a choice today for a 10-year purchase of a 10-year bond at whatever it is … or buying the S&P 500 and holding it for 10 years, I’d buy the S&P in a second.”—CNBC interview, February 2019
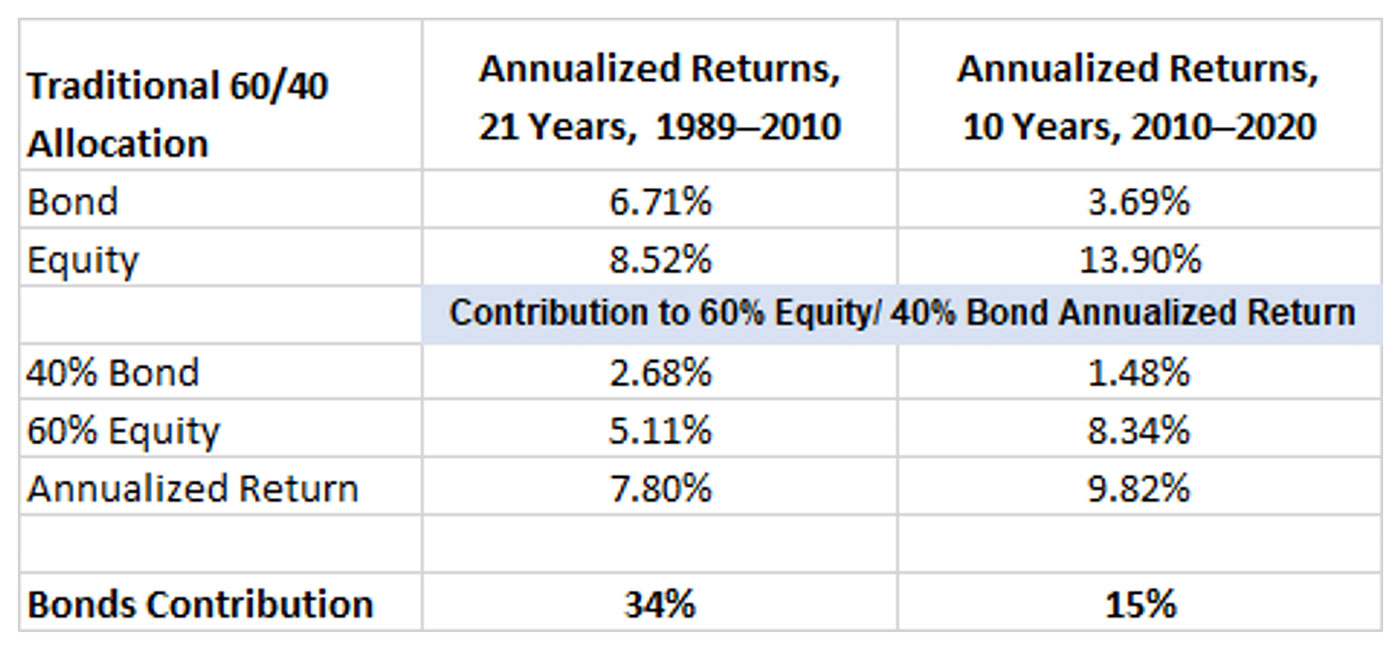
It would have paid to listen and acted. The traditional 60% equity/40% bond mix worked extremely well for decades but has become a relic. In fact, bonds have become a drag on performance for the past decade.
It could get worse.

Source: FastTrack, Bond—Vanguard Bond (VBMFX), Equity—S&P 500 (sp-da)
The traditional 60/40 worked so well for decades for a simple reason: The bond market was in a long-term secular bull dating back to the late 1980s. Bond yields then were in the double digits, offering extremely competitive returns to stocks, and as rates gradually fell, bond prices rose (bond prices and yields move inversely). So, bond investors benefited in two ways: high rates to start with plus rising bond prices as yields declined.
For 20-plus years, 1989–2010, bonds carried their weight, contributing 35% to the total return of a 60/40 allocation, while representing just 40% of the portfolio. Plus, bonds were a great counterweight during large equity declines in 2000–2002 and 2008–2009. That explains the popular wisdom of a 60/40 equity-bond mix for the past several decades.
However, by 2010, as Buffett sounded the early warning, that successful combination (relatively high current rates plus declining yields, translating into rising bond prices) no longer existed. Rates were low (3.3% for the 10-year U.S. Treasury) and further price appreciation was limited. In fact, they may have moved to “the most dangerous of asset classes.”
In viewing the stock market or stocks, one analytical tool used by investors is the price-to-earnings ratio (P/E). They use this ratio to determine if a stock or market is moving to extremes in valuations, high or low. It is not hard to find a headline today stating that the “market is overvalued” or “it has gotten ahead of itself”—or even more dramatic, “the market is in bubble territory.”
Current data supports observations of high P/Es for stocks. As of Dec. 31, 2020, the S&P 500’s price/Q4 trailing operating earnings was at 31.2, versus a 10-year average of 18.0. Or, looking at another perspective, the one-year forward P/E ratio was at 22.6 versus the 10-year average of 15.0.
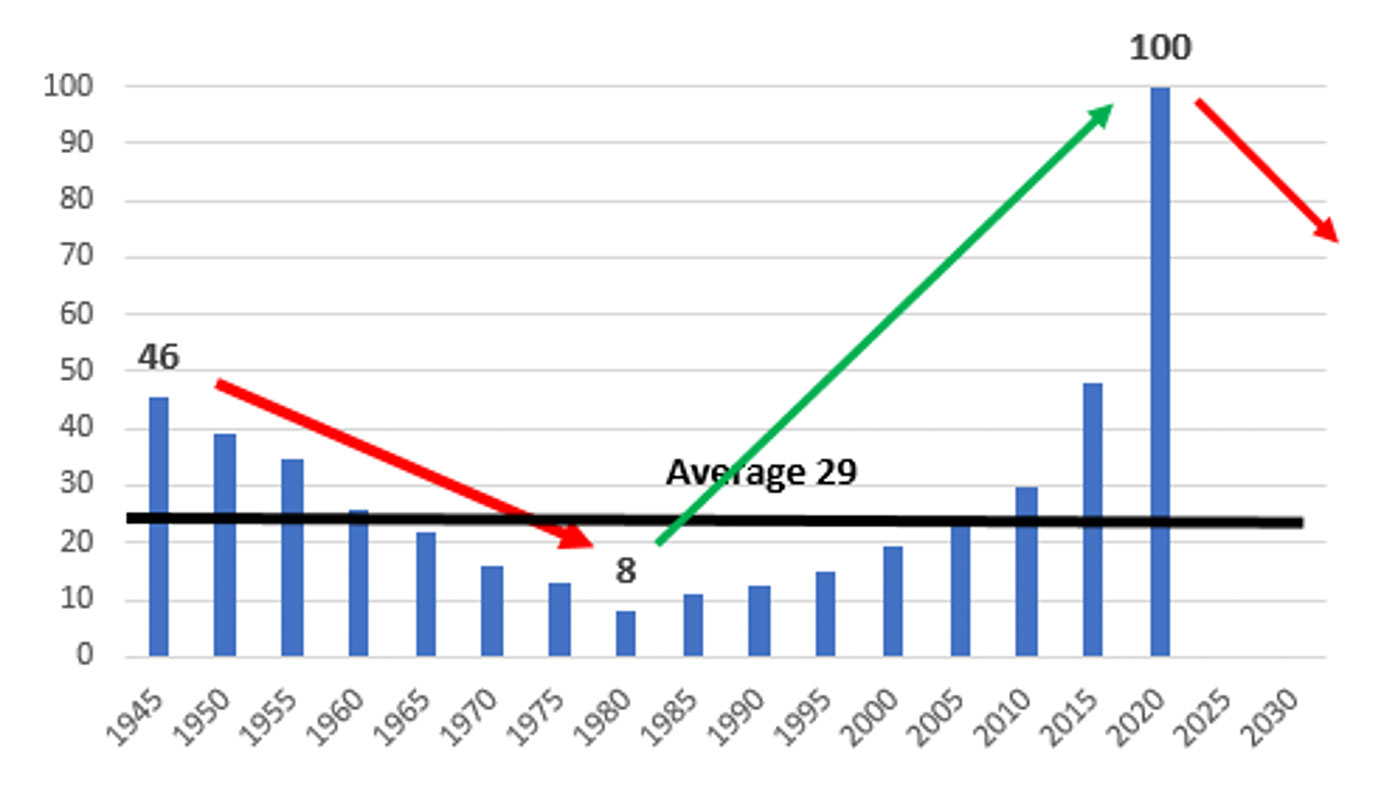
Bonds do not have a P/E ratio to look at to determine levels of extremes. However, looking at a price-to-yield (P/Y) ratio is alarming and informative:
- 1945–1982 was essentially a 37-year secular bond bear market, with rates climbing from 2.2% to a peak of 14.6% in 1982. This was truly a dangerous time for bond investors, given that as rates rise, bond prices fall. The P/Y fell from 46 to 8.
- A secular bond bull market took over in the early 1980s, with rates falling from double digits to a low of 0.5% in 2020.
- At the end of 2020, the P/Y ratio was 100—this after hitting 192 midyear when the yield was at 0.52%.
- The 75-year average P/Y is 29, which translates to a 3.3% average yield for the 10-year bond.

Sources: STIR Research, market data
Bonds are very expensive.
Even a move back to an average yield of around 3.3%, which could take years or even a decade, traps investors with a longer-term investment horizon in an asset class with little current return, plus little potential for bond price appreciation. In fact, it is the opposite scenario from what bond investors should be looking for. As yields rise, bonds prices will fall, creating a negative drag on the already low yields.
In Warren Buffett’s 2013 letter to Berkshire Hathaway investors, he noted that in his will he had instructed the trustee for his wife’s inheritance to allocate the cash he leaves 90% to equities (specifically an S&P 500 index fund) and 10% to short-term government bonds. This “formula” subsequently received many mentions in the financial media.
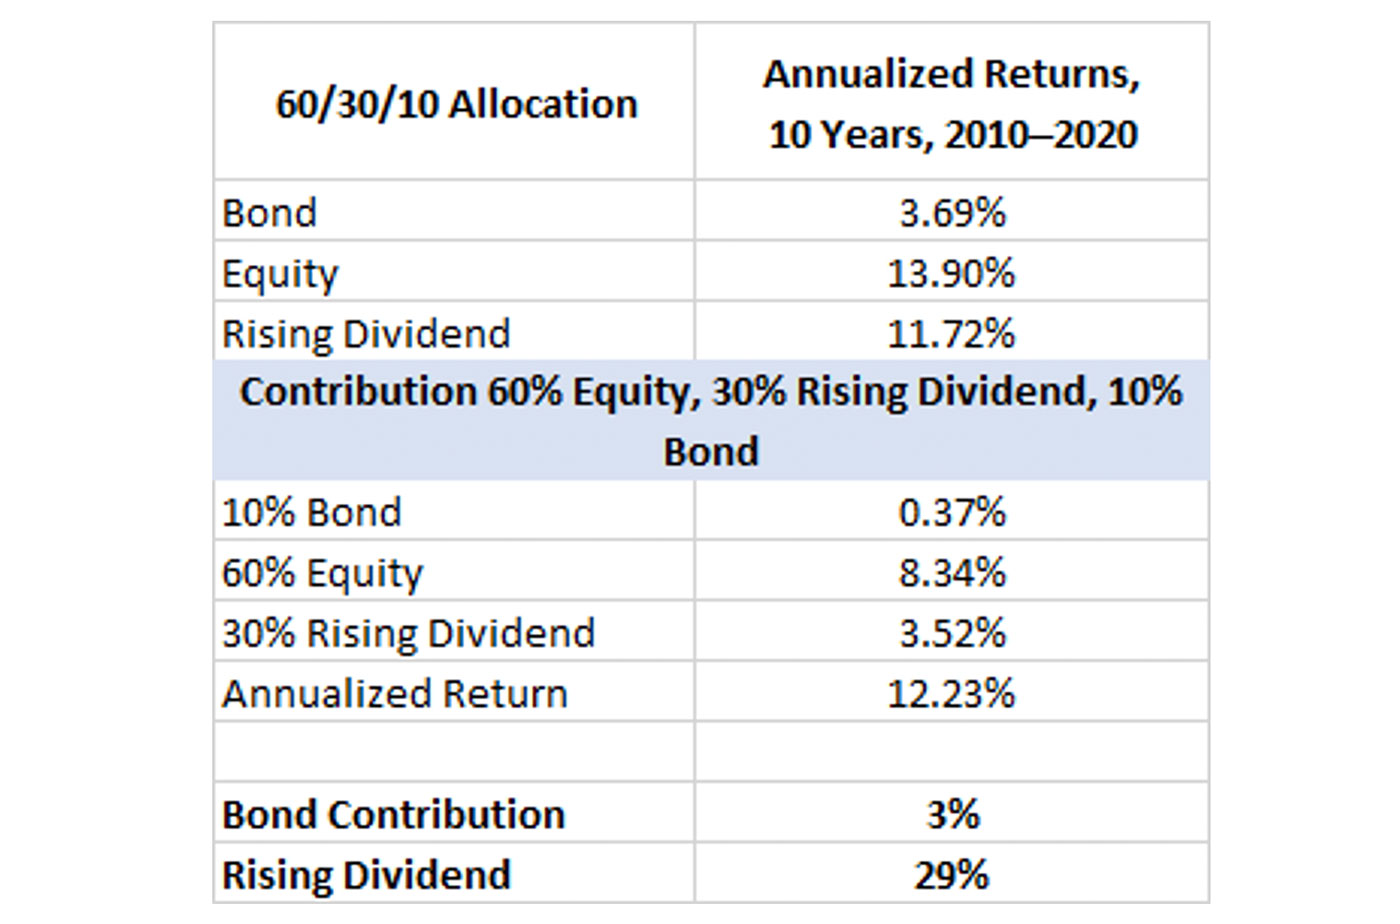
We suggest adjusting the 90/10 formula to 60/30/10: 60% equities, 30% rising-dividend equities, and 10% bonds.
Placing 30% in rising-dividends equities should generate a rising stream of income, and, historically, rising-dividend stocks have held their value better in market downturns while participating in market advances.
How did it work over the past decade?
- Rising-dividend equities carried their weight. With a 30% allocation, they contributed 29% of the total annualized return.
- Over the past 10 years, it would have raised one’s annualized return by 25%, from 9.8% to 12.2%.

Source: FastTrack, Bond—Vanguard Bond (VBMFX), Rising Dividend (VEIPX), Equity—S&P 500 (sp-da)
A 90/10 allocation may be suitable advice when your portfolio is in the billions or you have a long time horizon that allows you to comfortably weather bear markets. To make this concept more suitable for a broader segment of investors, a 60/30/10 mix would work best by adding a tactical overlay to the rising-dividend equity allocation. This would help to reduce risk in significant bear markets, while participating in the upside of bull markets.
Taking it a step further, another strong alternative would be to stick with the 60 equity/30 rising-dividend (including tactical overlay) allocations and substituting gold for the final 10% allocation. Total returns are similar, and gold can provide additional portfolio defense in falling equity markets.
 Marshall Schield is the chief strategist for STIR Research LLC, a publisher of active allocation indexes and asset class/sector research for financial advisors and institutional investors. Mr. Schield has been an active strategist for four decades and his accomplishments have achieved national recognition from a variety of sources, including Barron's and Lipper Analytical Services. stirresearch.com
