
In our June 9 article, “Consolidation confirmation,” we looked at how the market typically acts following longer-duration breadth thrusts, which took place the first week of June. We found that when more than 90% of the S&P 500 (SPX) components trade above their respective 50-day moving averages for at least 10 consecutive days, typically the market goes sideways for several weeks and sometimes up to three months.
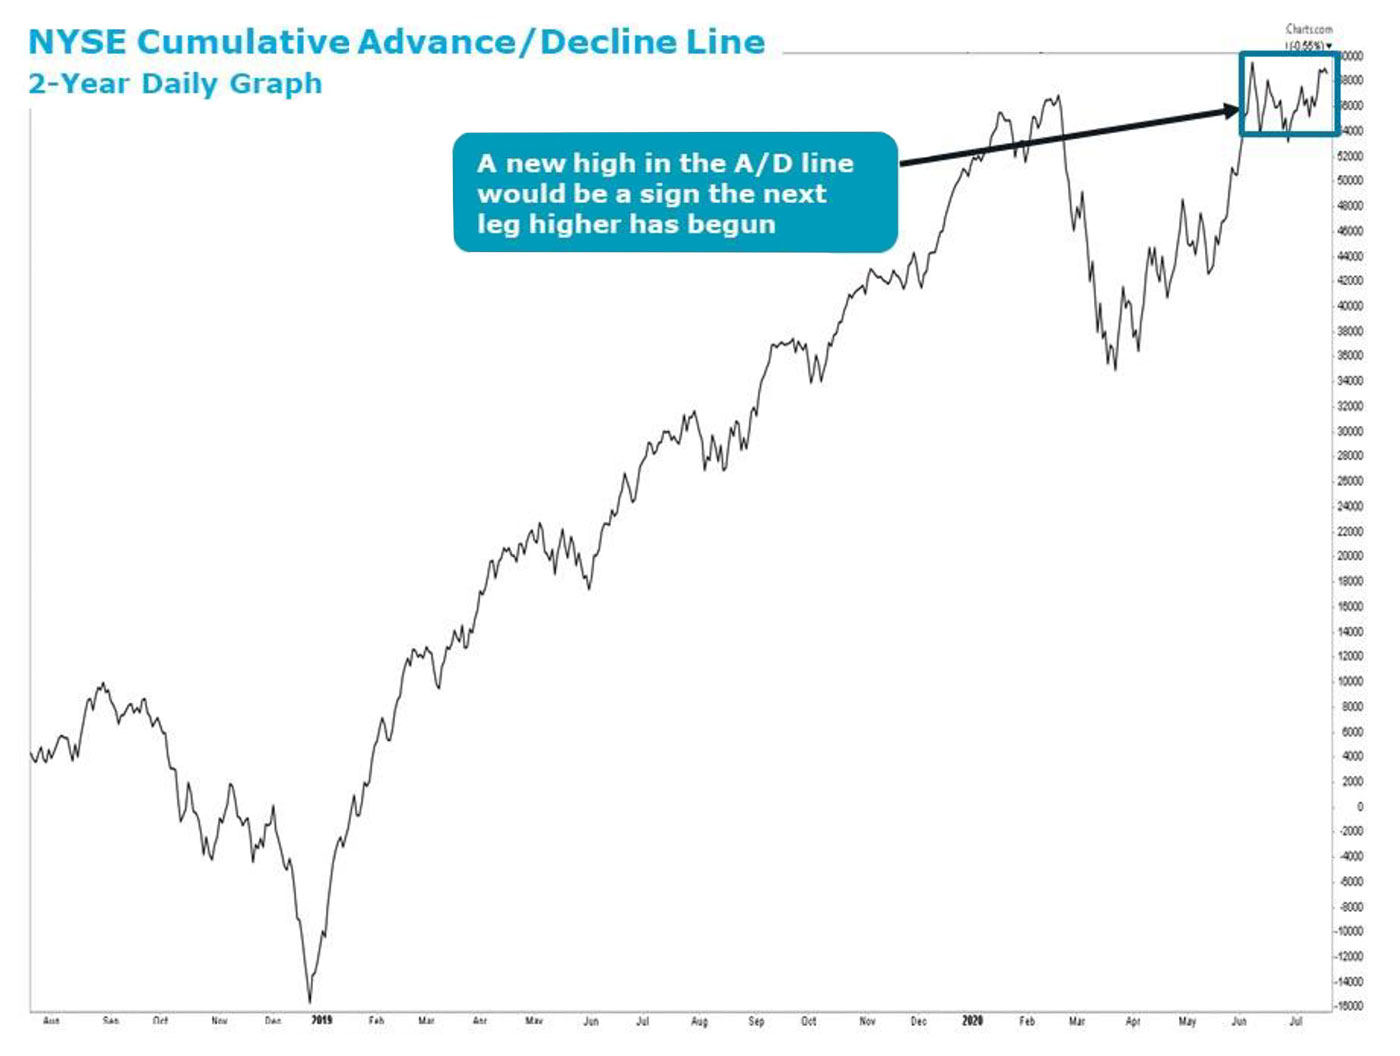
Ultimately, such consolidation periods following the breadth-thrust ramps we studied take place early in a new bull market and are resolved to the upside. Our tactical game plan since June 5 has been to add risk when the market moves back down to SPX 3,000, and we have used the two opportunities to do just that. With the SPX reaching a new recovery high, it makes sense to review our four key tactical indicators and the overall breadth of the market.

Sources: Canaccord Genuity, StockCharts.com
We have been watching for a rotational breakout—and this was clearly not yet it. In addition, our two most sensitive tactical indicators are showing neutral, while our two intermediate-term readings are showing a high level of optimism. Below are the levels where our four key tactical indicators currently stand:
- The percentage of SPX components above their 10- and 50-day moving averages dropped Monday (July 20) to 79% and 73%, respectively. While these readings remain a bit elevated, they fell yesterday despite the SPX rally.
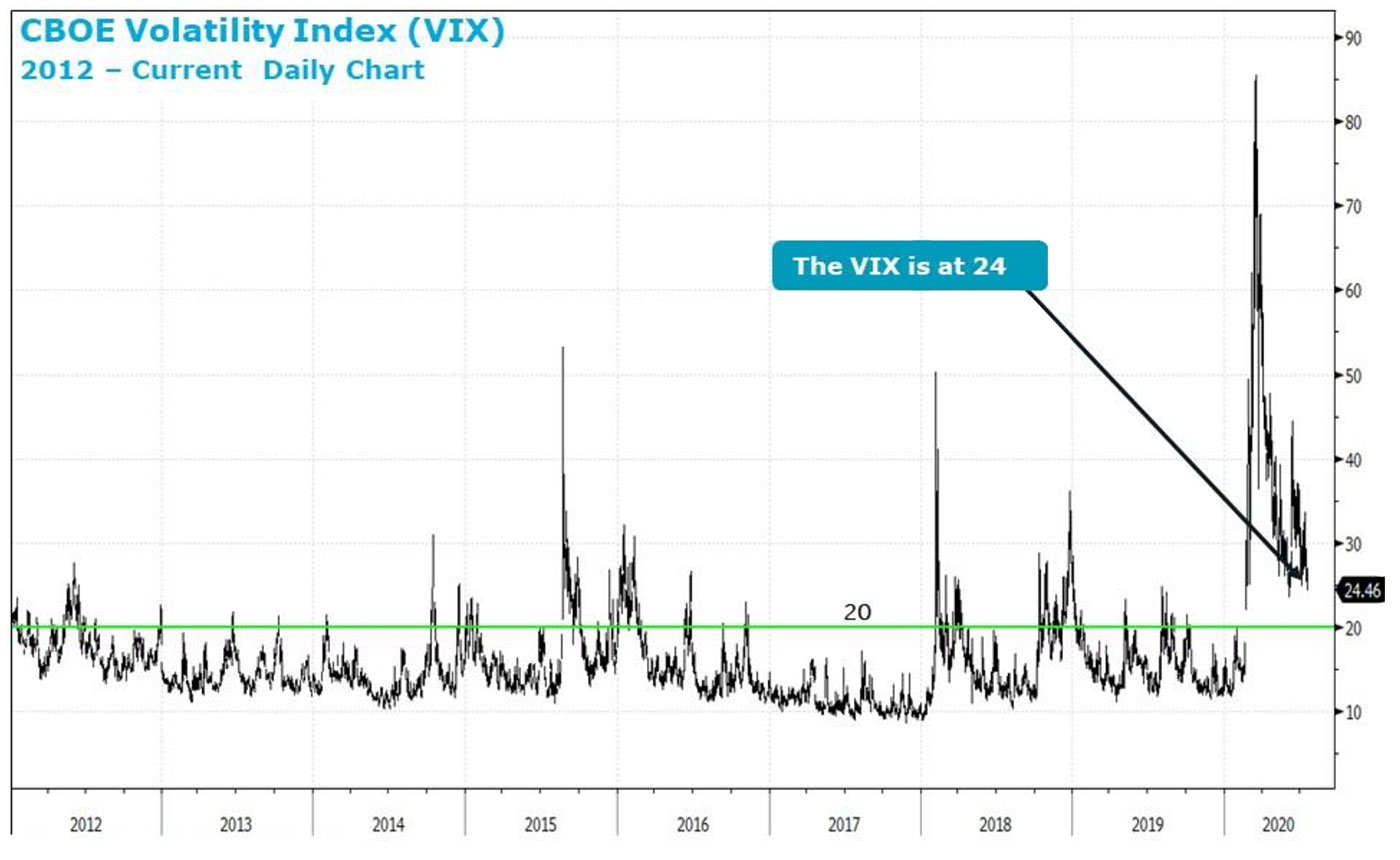
- The CBOE Volatility Index (VIX) is still at an elevated level of 24 (Figure 2). This is not atypical even this long after such a dramatic decline. Such historic volatility takes time to abate.

Sources: Bloomberg, Canaccord Genuity
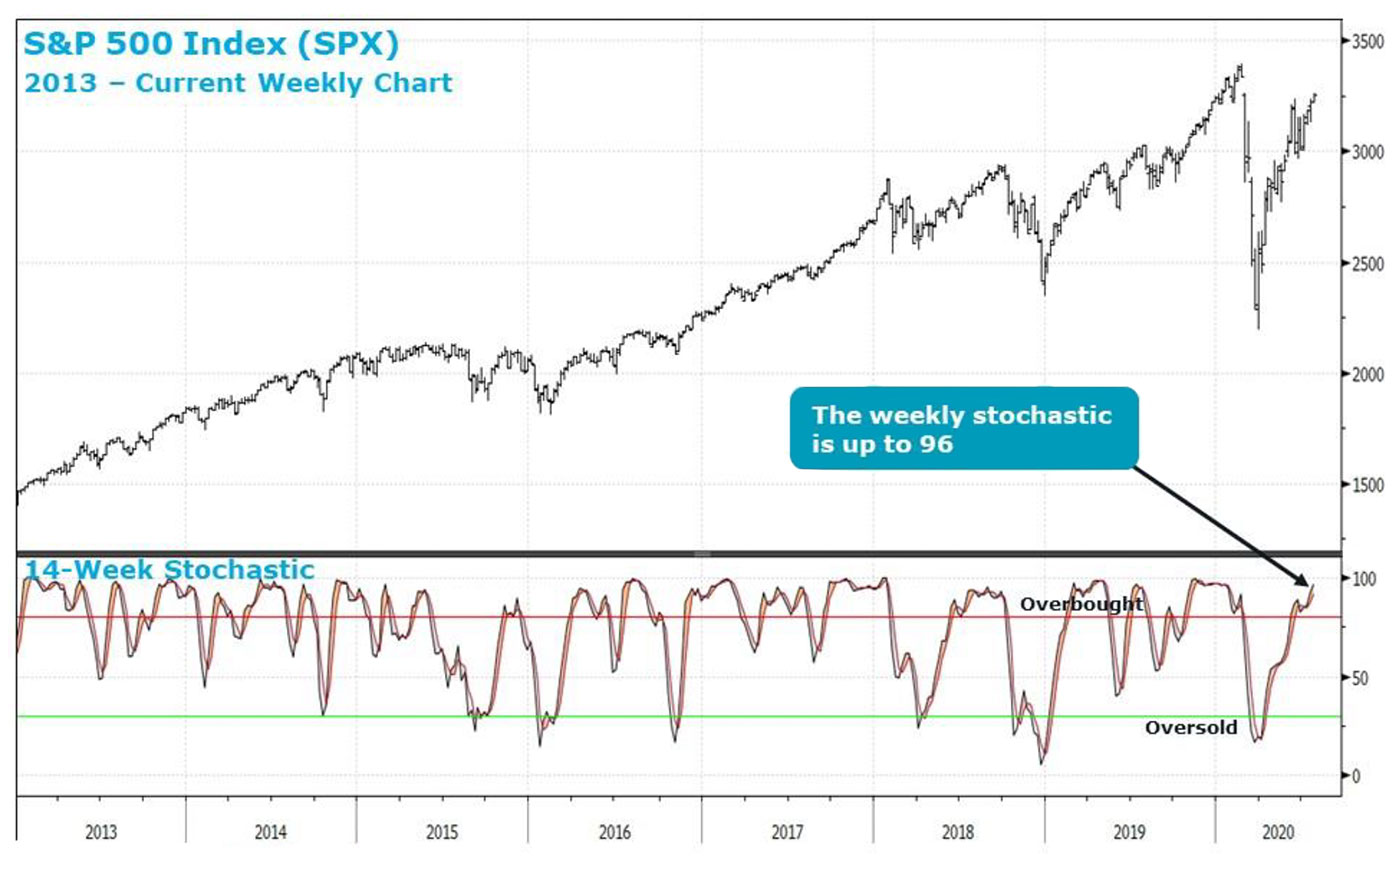
- The SPX 14-week stochastic indicator moved up to 96 (Figure 3). This is in extreme overbought territory, but as you can see from the past cycle, overbought can stay overbought for an extended period.

Sources: Bloomberg, Canaccord Genuity
- The Investor Intelligence percentage of bullish newsletter writers rose to 58.1% from 57.7% in the prior week. This is a bit worrisome, but the true euphoria typically comes with a reading closer to or above 60%, as was the case last cycle.
On July 16, we highlighted what it would take to convince us the broad equity market was beginning the next leg higher toward our target of SPX 3,300-plus, and yesterday’s ramp was not it. Only three of 11 S&P 500 sectors were higher on the day, and such a negative skew in breadth is a bit of a worrisome sign. Our positive fundamental core thesis driven by credit and liquidity should keep investors looking for entry points rather than fear of another major leg lower; but the consolidation in the market taking place over the past six weeks has created a mixed tactical picture. This suggests continuing to add exposure on weakness until there are signs of improved breadth as the major indexes make new recovery highs.
When we raised our 12-month S&P 500 (SPX) target to 3,300-plus, we added the plus because we have no idea what the multiple should be with the Fed and global central banks literally printing money for the foreseeable future. Our assumption is that it should be at least 20 times our 2021 SPX Operating EPS estimate of $165, but the valuation could be any level above that.
Given the valuation uncertainty, our focus is on potential rotation into the more economically sensitive areas given our core fundamental thesis driven by the following:
- Historically low core inflation that gives the Fed permission to print money.
- The Fed should keep rates at zero for the foreseeable future given inflation.
- Money availability as seen through real liquidity is beyond historic due to monetary and fiscal stimulus measures.
- The global economy is at the beginning of a synchronized recovery.
- EPS should recover into 2021 and valuations are expanding.
We believe the combination of incredible monetary and fiscal stimulus, historic excess liquidity, a synchronized global economic recovery, and significant underperformance of the economically sensitive areas set the stage for a long-term rotation into the Industrial, Financial, Materials, and Consumer sectors. In our view, if the mega-cap “stay at home” stocks are still leading over the next six to 12 months, it would mean the economy is still largely shut down, which would likely create a very negative backdrop for credit. Given the historic issuance of credit, a very negative outlook for credit would bring about significant market risk. There are factors that could create increased near-term volatility, including profit taking in the mega-cap stay-at-home stocks, the coming election, talk of tax increases, and escalation in tension with China, but we believe our core thesis and the very different macro backdrop versus 1999 suggest any pullbacks should prove temporary.
The opinions expressed in this article are those of the author and do not necessarily represent the views of Proactive Advisor Magazine. These opinions are presented for educational purposes only.
This Macro Strategy perspective was first published on July 21, 2020, supplemented with excerpts from a perspective published on July 23, 2020.
 Tony Dwyer is the head of the U.S. Macro Group and chief market strategist at Canaccord Genuity. He also sits on the firm’s U.S. operating committee. Mr. Dwyer joined Canaccord Genuity in 2012 and is known for the practical application of macroeconomic and tactical market indicators. Mr. Dwyer was previously equity strategist and director of research at Collins Stewart and a member of the firm's executive committee. Mr. Dwyer is a frequent guest on many financial news networks. canaccordgenuity.com
