
The dynamics of gold: Performance across different market scenarios
The dynamics of gold: Performance across different market scenarios

The role of gold in investment portfolios: Part I
Should an investment in gold be a key element of effectively diversified and risk-managed portfolios?
Editor’s note: Flexible Plan Investments, a leading provider of dynamically risk-managed investment strategies, first authored an extensive analysis of the role of gold in investment portfolios in 2013 and has provided periodic updates. This white paper has been recently updated for 2026 and will be presented as a guest commentary in three parts in Proactive Advisor Magazine. We are pleased to present Part I here.
Overview
Our study adds hard data to a debate often driven by intuition: how much gold, if any, belongs in a long-term allocation.
We analyzed more than 50 years of market data across five major asset classes—stocks, bonds, gold, commodities, and currencies—to investigate gold’s place in a diversified portfolio. We tracked gold’s behavior across several different market and economic environments to see whether it can add return and hedge against risks associated with other asset classes. The results challenge conventional allocation recommendations and could change how investment professionals approach building portfolios.
Gold through the ages
Gold has long been a symbol of wealth, power, and permanence. From ancient Egyptian tombs to modern central-bank vaults, its luster has captivated civilizations across time and geography.
According to the World Gold Council, gold’s monetary role began around 550 B.C., when the Lydians produced the first standardized gold coins. That innovation created a portable, divisible medium of exchange with intrinsic value. For the next 2,500 years, gold underpinned commerce worldwide, culminating in the classical gold-standard era (1870s–1914), when most countries tied their currencies to it.
The 20th century brought major change. Under Bretton Woods (1944–1971), the dollar was pegged to gold at $35 per ounce, and other currencies were pegged to the dollar. When this system ended in 1971, exchange rates began to float, and investors faced a new world of purely fiat currencies. This shift created challenges for investors and opportunities for gold.
Over the half-century since, gold has evolved from currency to a strategic investment asset. According to Visual Capitalist, central banks shifted from net sellers of gold reserves to net buyers after 2010. Access to gold has also increased. The first gold ETFs launched in U.S. securities markets in 2004, making it easier for retail investors to buy gold. In 2013, the first—and still only—mutual fund and variable annuity subaccount seeking to reflect the daily price change of gold both began trading.
For portfolio managers, gold offers something rare: an asset backed by centuries of steady demand. That demand comes from diverse sources—as an investment, as a reserve asset, in jewelry, and as a technology component. Supply grows very slowly. The question is whether the strong demand brings measurable benefits for today’s investors. In this study, we attempt to provide a data-driven answer.
Common arguments for gold
Before we dive into the numbers, let’s look at the traits that set gold apart from other investments—and why investors keep turning to it in different economic environments.
Ray Dalio of Bridgewater Associates summed up one practical view in a 2019 LinkedIn post:
The case for holding gold rests on several measurable characteristics:
- Inflation protection: Gold has held its value during times of significant currency decline.
- Currency diversification: As a non-sovereign asset, gold can offset dollar depreciation.
- Crisis resilience: During systemic market stress, gold often exhibits countercyclical performance.
- Supply constraints: The Perth Mint states that mining adds only about 2% to existing stock annually. This keeps inflationary pressure low.
- Central-bank demand: As stated in the previous section, central banks have been net buyers of gold since 2010.
- Portfolio diversification: Gold’s low correlation with traditional financial assets enhances portfolio efficiency.
- Long-term performance: From 2000 through 2025, gold has outpaced the total returns of both the S&P 500 and the NASDAQ 100.
Addressing gold’s critics
Despite its long history of performance, gold still draws two common objections that often deter investors from considering it as a strategic allocation. Each has a kernel of truth, yet neither is a decisive reason to exclude gold from a portfolio.
Objection 1: ‘Gold has no intrinsic value.’
Gold pays no dividend or interest, so some critics see it as inferior to yield-producing assets. That view misses gold’s main role: preserving purchasing power across monetary regimes and economic cycles. This role is especially important during periods of inflation, currency crises, and financial instability.
The recent era of negative-yielding sovereign debt helps make that point. When investors accepted guaranteed losses on government bonds for perceived safety, gold’s lack of yield became less relevant. Even when nominal bond yields were positive, inflation often pushed real yields below zero. During those negative-real-rate periods, gold’s price gains have more than offset the income foregone on traditional fixed income.
Capital appreciation alone has rewarded long-term holders. Gold has risen from $35 an ounce in 1971 (when the dollar was decoupled from the metal) to a peak of more than $5,400 in 2026—a compound annual growth rate that rivals income-producing assets over the same period.
Objection 2: ‘Gold underperforms equities in the long run.’
Equities do lead over very long horizons. But gold has outperformed stocks for extended stretches as well. This makes gold potentially profitable for tactical trading between asset classes.
From January 2000 through December 2025, a span covering multiple market cycles, gold’s annualized return was higher than the total returns of the S&P 500 and the tech-heavy NASDAQ Composite and NASDAQ 100 Indexes.
Two points further challenge the “equities always win” claim:
- Stress periods favor gold. Gold tends to lead when stocks suffer deep drawdowns—precisely when other diversifiers, such as bonds, may stumble. The “lost decade” from 2000 to 2009 illustrates this pattern: Two major bear markets left equities with a negative 10-year return, while gold gained more than 200%.
- Portfolio context matters. Investors should judge assets by what they add to the whole, not by stand-alone returns. Our study shows that gold’s low correlation with stocks and bonds has improved risk-adjusted results even when its absolute return lagged equities.
 Related Article: The benefits of true diversification
Data and methodology
Time frame and baseline returns
Our study focuses on gold’s performance relative to other major asset classes under various market and economic conditions since 1973, following the U.S. abandonment of the gold standard. We begin in 1973 because that is the earliest point for which we have consistent data across all the asset classes analyzed.
For years, the U.S. fixed the price of gold at $35 per ounce and exchanged U.S. dollars for gold only at that set rate. In 1971, the Nixon administration made the important decision to remove the U.S. from the gold standard. Since then, investors have faced energy crises, interest-rate spikes in the 1970s and early 2020s, the COVID pandemic and subsequent lockdowns, and many significant macroeconomic and geopolitical events—including the major stock market booms and busts of the 1990s and 2000s.
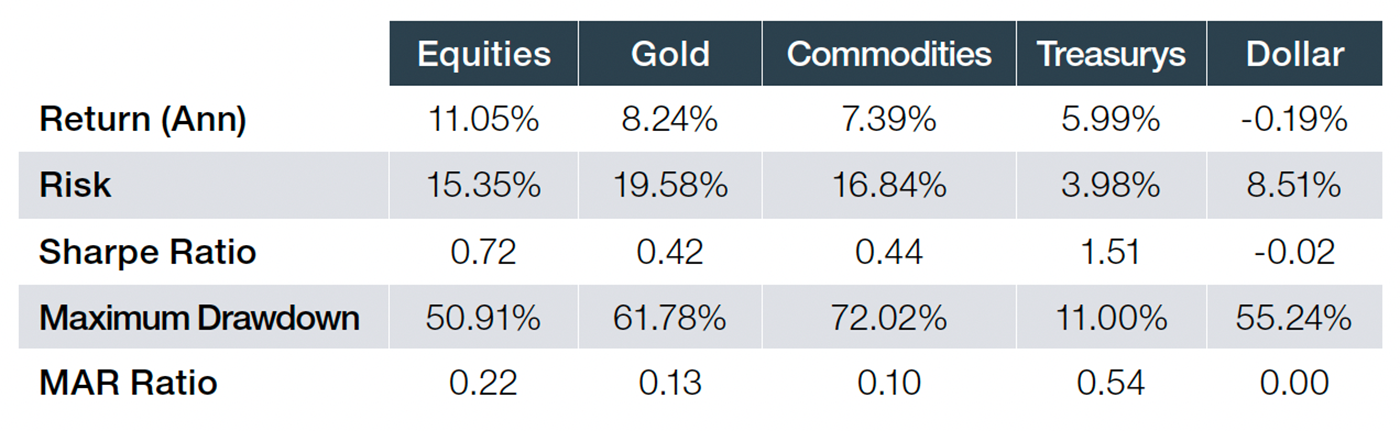
In the following chart and table, we establish a baseline for our asset classes by examining their annualized rate of return and risk and return statistics from February 1973 through December 2025.
FIGURE 1: BASELINE—PERFORMANCE OF VARIOUS ASSET CLASSES (1973–2025)
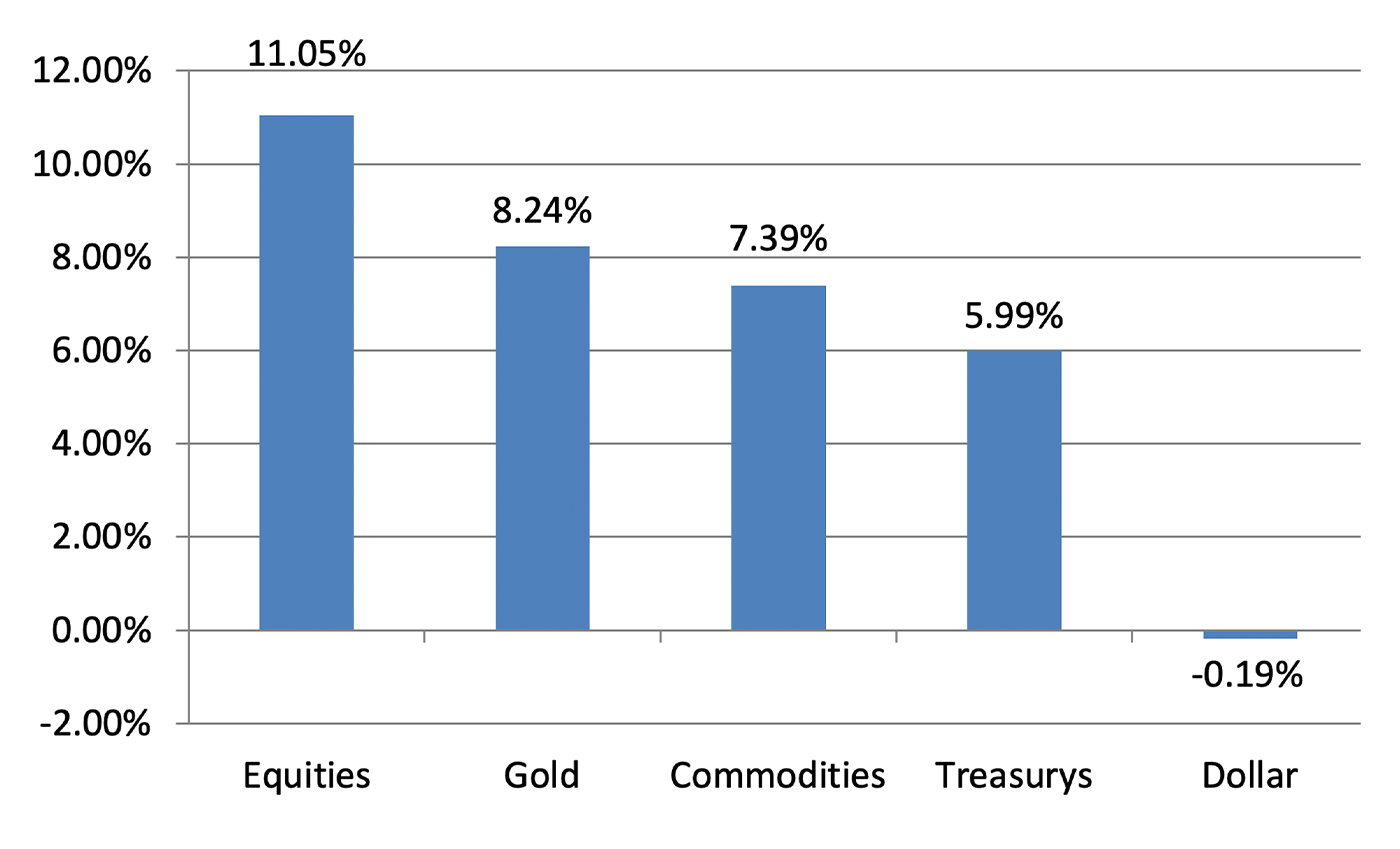
Definition: Annualized returns of various asset classes over the study period. Download the complete white paper for more information on source data.
Source: Flexible Plan Investments
TABLE 1: RISK AND RETURN STATISTICS OF MAJOR ASSET CLASSES (1973–2025)
Source: Flexible Plan Investments
Equities were the best-performing asset class over this period, followed by gold and commodities. But the ride was far from smooth. Gold’s path was even bumpier, but it showed it could outperform equities during periods of equity market stress, proving to be an even better alternative than bonds during various economic and market conditions.
Research methodology
To analyze gold’s performance during periods of market stress, we applied a systematic four-phase framework that (1) isolates specific market and economic environments, (2) measures asset-class behavior inside those environments, (3) links and annualizes the results, and (4) ranks gold against its peers.
Phase 1: Define each crisis scenario
We began by establishing objective thresholds for our eight crisis scenarios:
- Equities are in a bear market: Equity prices are down 20% or more from their previous peak.
- Real rates on Treasury bonds are negative: The 10-year Treasury yield minus the concurrent consumer price index (CPI) inflation rate is below zero.
- Commodities are in a bull market: Commodities are up 20% or more from their previous trough.
- The U.S. dollar is in a bear market: The U.S. Dollar Index is down 10% or more from its previous peak.
- Inflation is rising: The year-over-year increase in CPI is greater than the previous month’s year-over-year increase.
- Inflation is high: The annualized inflation rate exceeds 3.97% (the average for the study period).
- Market volatility is high: The VIX reading is in the top 20% of historical data.
- U.S. economic-policy uncertainty is high: The U.S. Monthly Economic Policy Uncertainty Index is in the top 20% of historical data.
We used these definitions to classify each month in our data set—February 1973 through December 2025—according to which conditions were present. The time frame for the “high market volatility” scenario begins in 1990, the earliest point for which VIX data are available.
Phase 2: Calculate returns for each scenario
For each period that met a scenario’s threshold in Phase 1, we measured the total return of the five study assets—gold, equities, Treasurys, commodities, and the U.S. dollar—considering the following factors:
- Price change
- Income (dividends for equities, coupon payments for bonds)
- Reinvestment of that income
This calculation yielded the exact gain or loss for each asset across every period classified under each crisis scenario.
Phase 3: Aggregate and annualize returns
Each crisis scenario occurs in several separate stretches of time. We therefore used a geometric-linking method that preserves the compound growth characteristics of investment returns:
- We first calculated each environment-specific return at a monthly rate.
- We then compounded these monthly rates across all occurrences of each environment type.
- We then annualized the resulting compound growth rate using the standard formula: Annualized Return = [(Ending Value/Beginning Value) ^(1/Years)] – 1.
This approach avoids distortions from averaging returns and better reflects the experience of an investor who remained invested in each asset during every episode of a given scenario.
Phase 4: Compare results across assets
In the final step, we lined up the annualized returns from Phase 3 to see how the five assets stacked up in each of the eight crisis scenarios. This side-by-side view tells us
- which asset classes led or lagged in every scenario,
- by how much,
- how consistently each asset behaved across scenarios, and
- whether any surprising outliers challenged common assumptions.
These comparisons grounded our conclusions about gold in objective, long-term data rather than theory.
Gold in periods of crisis
This section applies the four-phase framework to each of the eight crisis scenarios defined earlier. For each scenario, we show how gold, stocks, Treasurys, commodities, and the U.S. dollar performed, then summarize the patterns that emerged and what they mean for portfolio design.
Scenario 1: Equities are in a bear market
We start with one of the most concerning scenarios for investors: an equity bear market. We defined a bear market as a 20% drop from the prior peak and a bull market as a 20% rise from the prior trough. We used those cutoffs to divide the 1973–2025 study period into bull and bear stretches. We then measured each asset’s total return during the bear periods (Figure 2).
FIGURE 2: PERFORMANCE OF VARIOUS ASSET CLASSES IN EQUITY BEAR MARKETS (1973–2025)
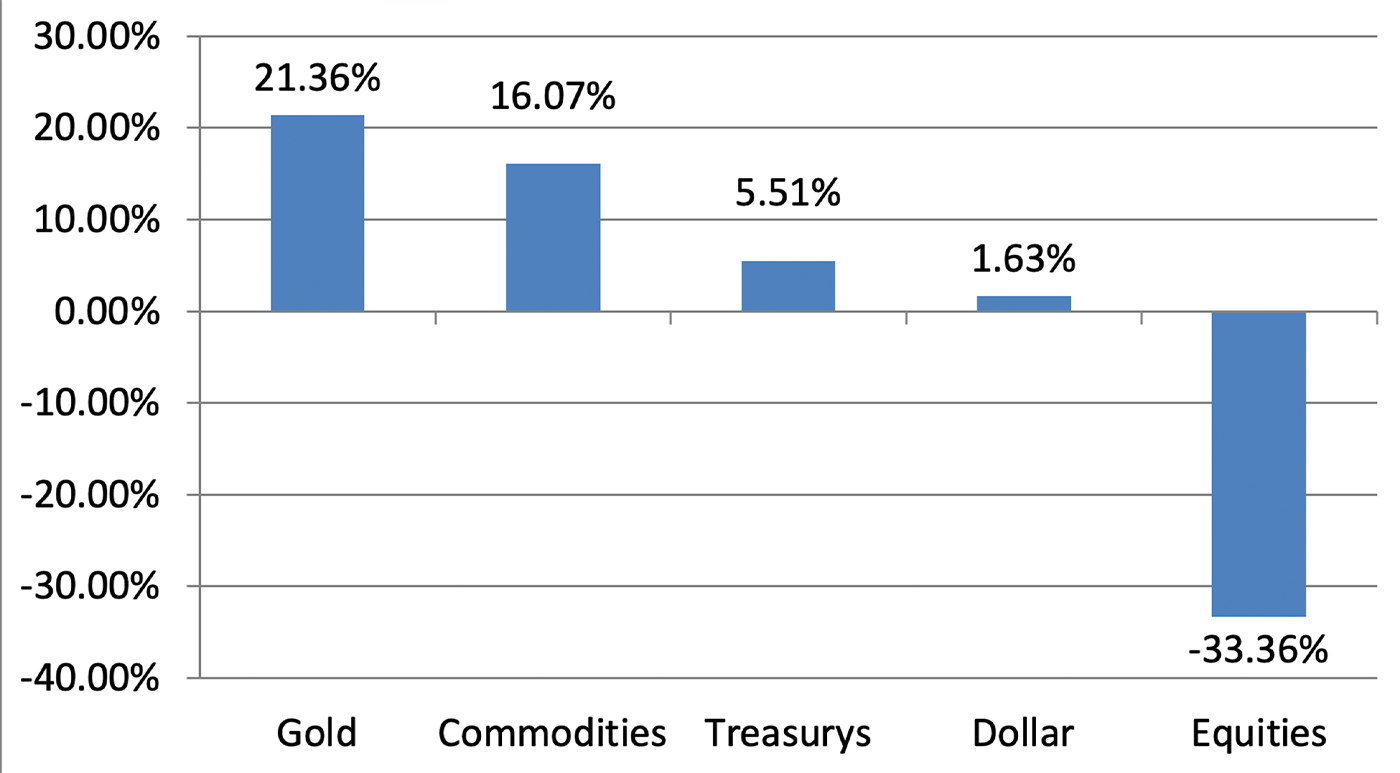
Definition: Equity prices fall 20% or more from the prior peak.
Source: Flexible Plan Investments
Gold had the best compounded return of the five assets. It even outperformed Treasurys, the usual safe-haven favorite. Investors often turn to gold during turbulent economic times. Because only a small fraction of gold demand comes from industrial uses, its price is less sensitive to swings in economic activity.
During the major equity bear market and global financial crisis from November 2007 through February 2009, equities fell at an annualized rate of 41.36%. In contrast, gold rose at an annualized rate of 15.07%, outperforming Treasurys and the U.S. dollar, which gained at annualized rates of 9.18% and 11.11%, respectively. Commodities sank at an annualized rate of 32.70%, failing to provide the safety net that gold did.
Scenario 2: Real rates on Treasury bonds are negative
An important benchmark for investor returns is the “real” 10-year Treasury yield, which we calculate as the yield on the 10-year Treasury bond minus the inflation rate for the period. Because the Treasury return is considered virtually “risk-free,” it represents what an investor can expect to earn on a long-term investment, adjusted for changes in currency purchasing power.
When real yields are positive, equities and bonds tend to perform well as long-term investments. The nightmare for pension-fund and other asset managers is when real yields are negative. In those periods, some investors accept a negative real return in exchange for perceived safety and the likelihood that they will recover most of their invested principal.
Negative real rates became more common after the 2007–2009 financial crisis, when the Federal Reserve systematically lowered interest rates to near-zero levels to stimulate the economy. Treasury yields fell below the inflation rate (indicating that real yields were negative) for much of 2011 and 2012, and again from 2020 to 2023.
In this setting, the key question is, “How can investors earn a real return on their investments?” History points to gold as one possible answer.
Figure 3 shows the compounded annual return for various asset classes when real 10-year yields are negative.
FIGURE 3: PERFORMANCE OF VARIOUS ASSET CLASSES WHEN REAL RATES ARE NEGATIVE (1973–2025)
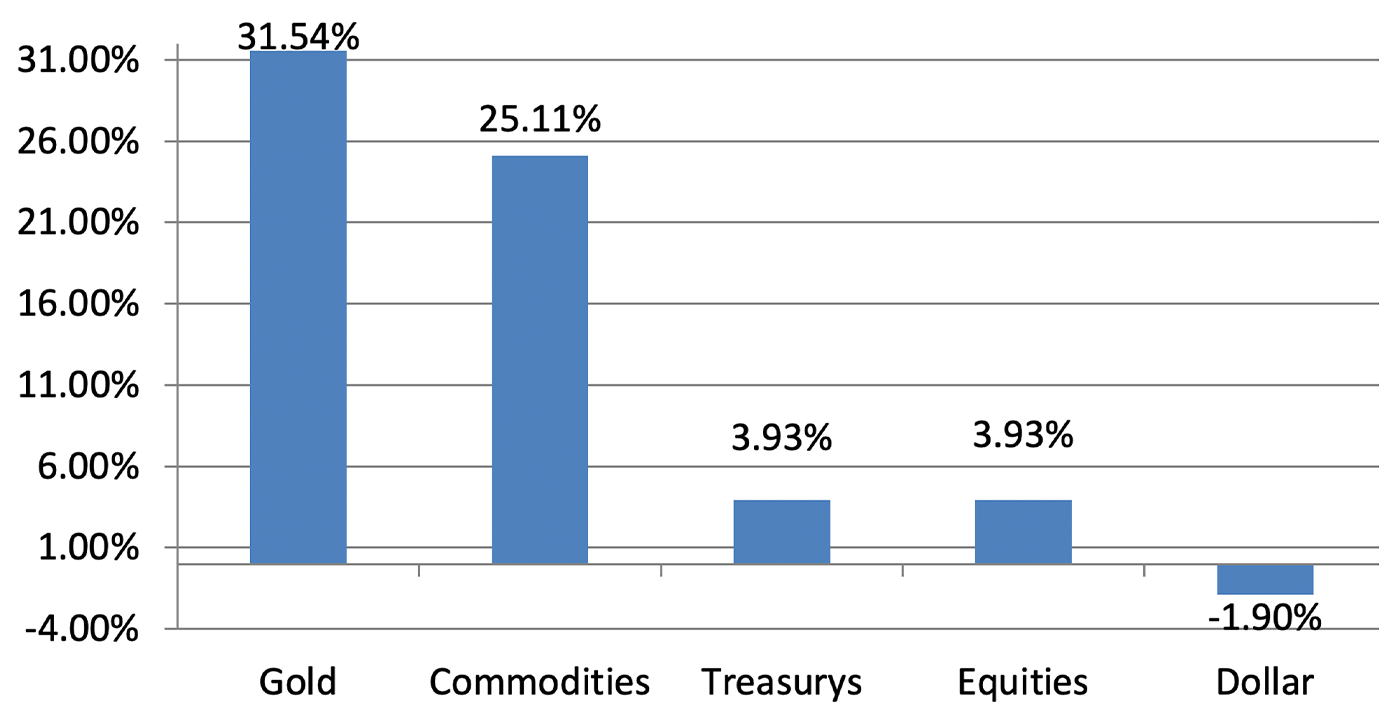
Definition: The yield of a 10-year Treasury bond minus the inflation rate is negative.
Source: Flexible Plan Investments
Gold delivered an annualized return of more than 31%, the best of any asset class. Commodities also did well, but the other asset classes fared far worse in this environment.
During the time frame analyzed, many periods of negative real rates overlapped with high inflation—another environment in which gold performed well.
Scenario 3: Commodities are in a bull market
A broad commodity rally can spell trouble for traditional portfolios. Rising input costs could squeeze profits, increase consumer inflation, and lead to tighter monetary policy.
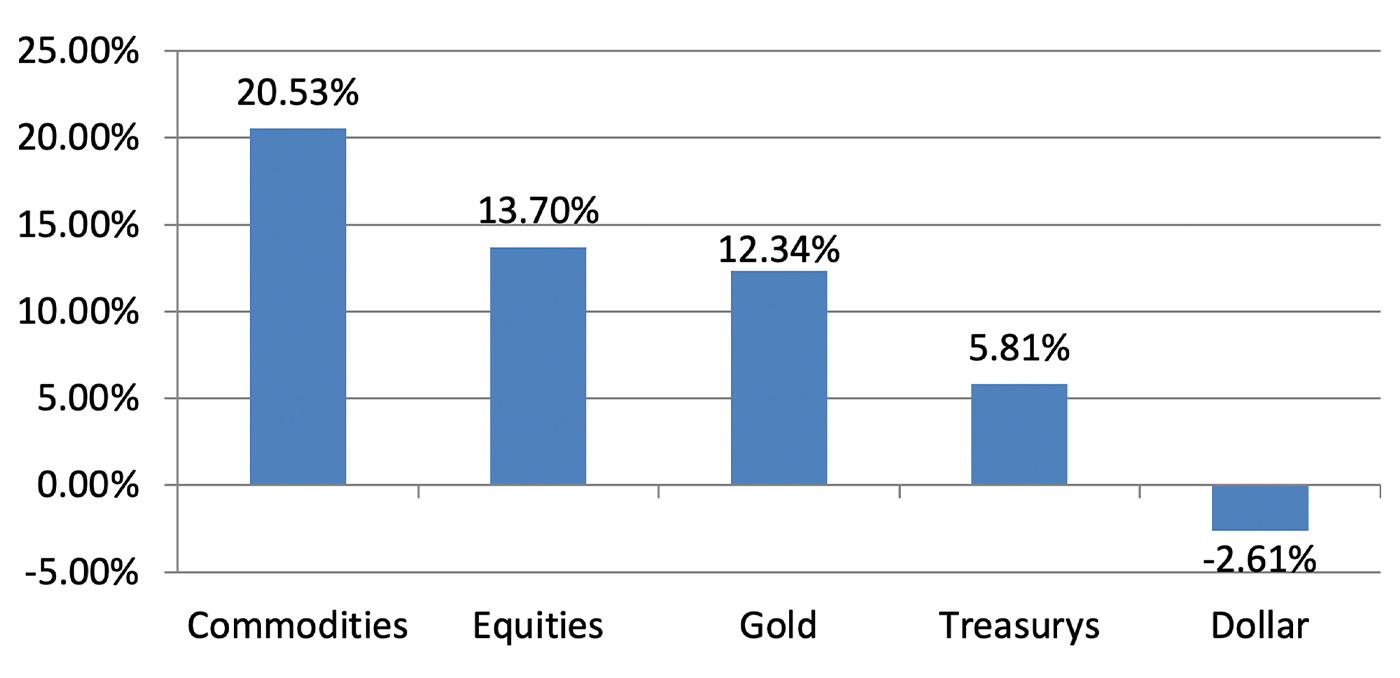
We define a commodity bull market as any period in which commodities rise 20% or more from their previous trough. Figure 4 shows how each asset class performed in all such runs during our study period.
FIGURE 4: PERFORMANCE OF VARIOUS ASSET CLASSES IN COMMODITY BULL MARKETS (1973–2025)
Definition: Commodities rise 20% or more from the prior trough.
Source: Flexible Plan Investments
Gold ranked third during these periods, trailing commodities and equities. Gold kept up with commodity returns better than bonds and the dollar.
One significant commodity bull market ran from March 1975 to October 1980. This period coincided with U.S. President Jimmy Carter’s warning that the world was running out of oil, heightened tensions with Iran, and a phased deregulation of oil prices. Commodities rose at an annualized rate of 26.91% over that period, while gold was close behind at 24.49%.
Scenario 4: The U.S. dollar is in a bear market
A U.S. dollar bear market—which we define as periods when the U.S. dollar falls 10% or more—can stem from factors such as trade deficits or monetary policy decisions. When this occurs, the dollar loses value against other currencies.
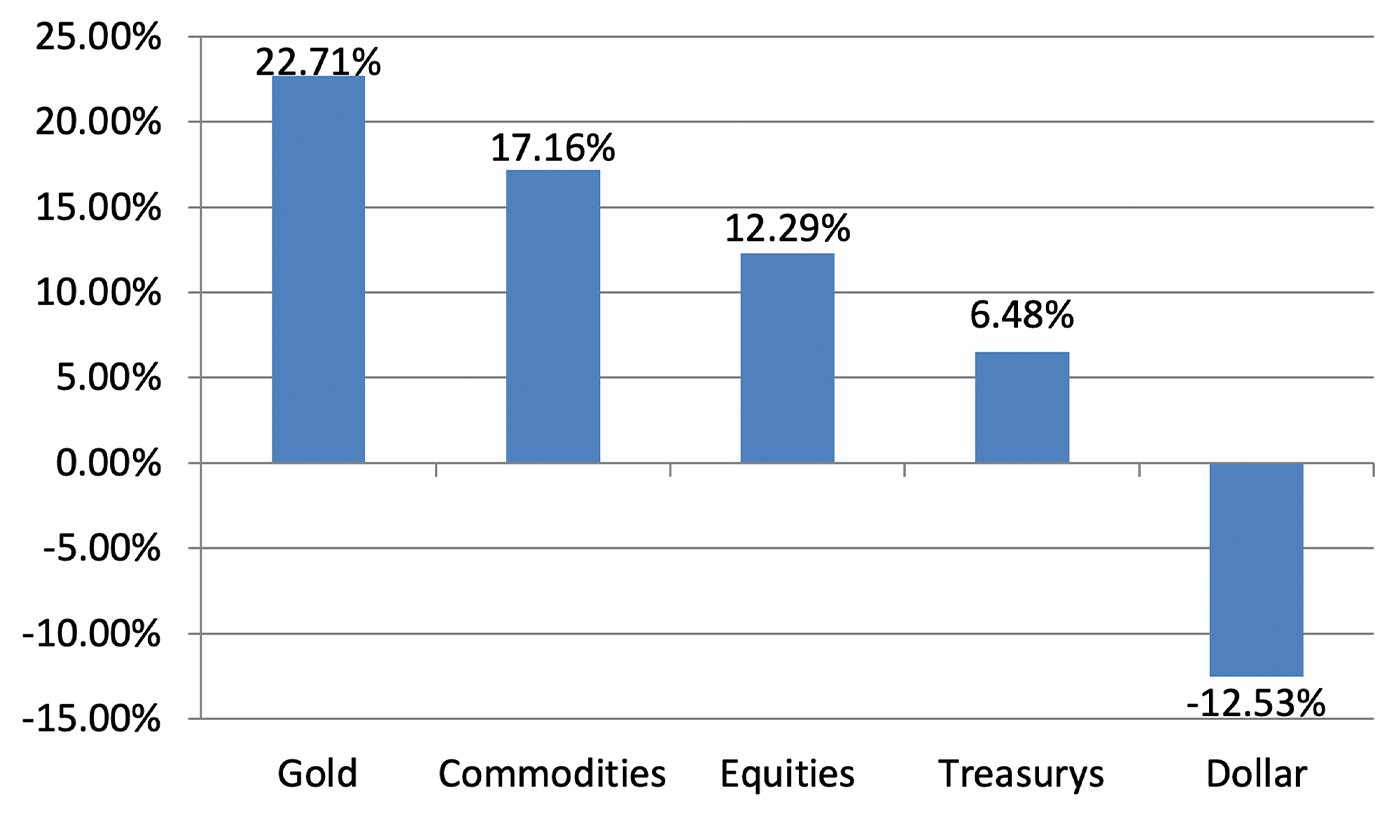
Figure 5 shows how each asset class performed during these periods. Gold’s strength is evident when the U.S. dollar’s value has decreased relative to a “basket” of foreign currencies.
FIGURE 5: PERFORMANCE OF VARIOUS ASSET CLASSES IN U.S. DOLLAR BEAR MARKETS (1973–2025)
Definition: U.S. dollar prices fall 10% or more relative to a “basket” of foreign currencies.
Source: Flexible Plan Investments
Gold was the top-performing asset class during these periods, which may partly reflect its reputation among investors as the “currency of last resort.”
A dollar bear market at the start of our study period provides a notable example. From February to July 1973, shortly after the U.S. dollar exited the Bretton Woods arrangement, it experienced a bear market, declining at an annualized rate of 27.36%. Gold rose at an annualized rate of 206.78% over the same period.
Scenario 5: Inflation is rising
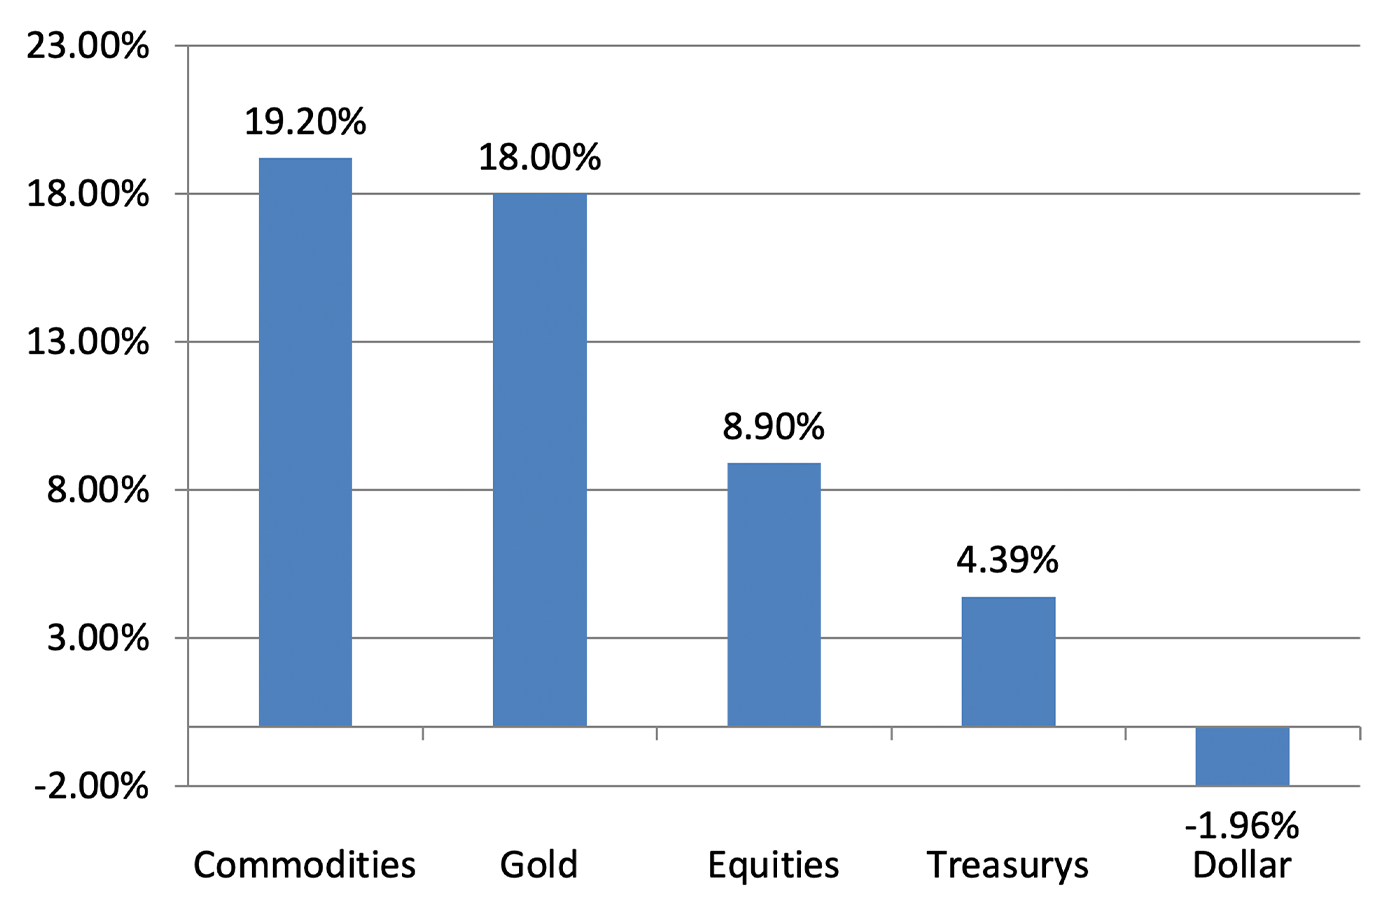
Figure 6 shows gold’s strong performance during periods of rising inflation for goods and services, as indicated by the CPI.
FIGURE 6: PERFORMANCE OF VARIOUS ASSET CLASSES WHEN INFLATION IS RISING (1973–2025)
Definition: The year-over-year CPI increase is higher than in the previous month.
Source: Flexible Plan Investments
In this environment, the U.S. dollar was the only asset to decline. Commodities had the best return while inflation was rising, but gold was a close second.
Extended stretches of consistently rising inflation are rare. One of the longest ran from May 1978 to March 1980. Inflation slowed in just two months during that time. During the months when inflation rose in that stretch, gold gained at an annualized rate of 113.65%. The next-best performer—commodities—gained at a rate of only 52.00%.
Scenario 6: Inflation is high
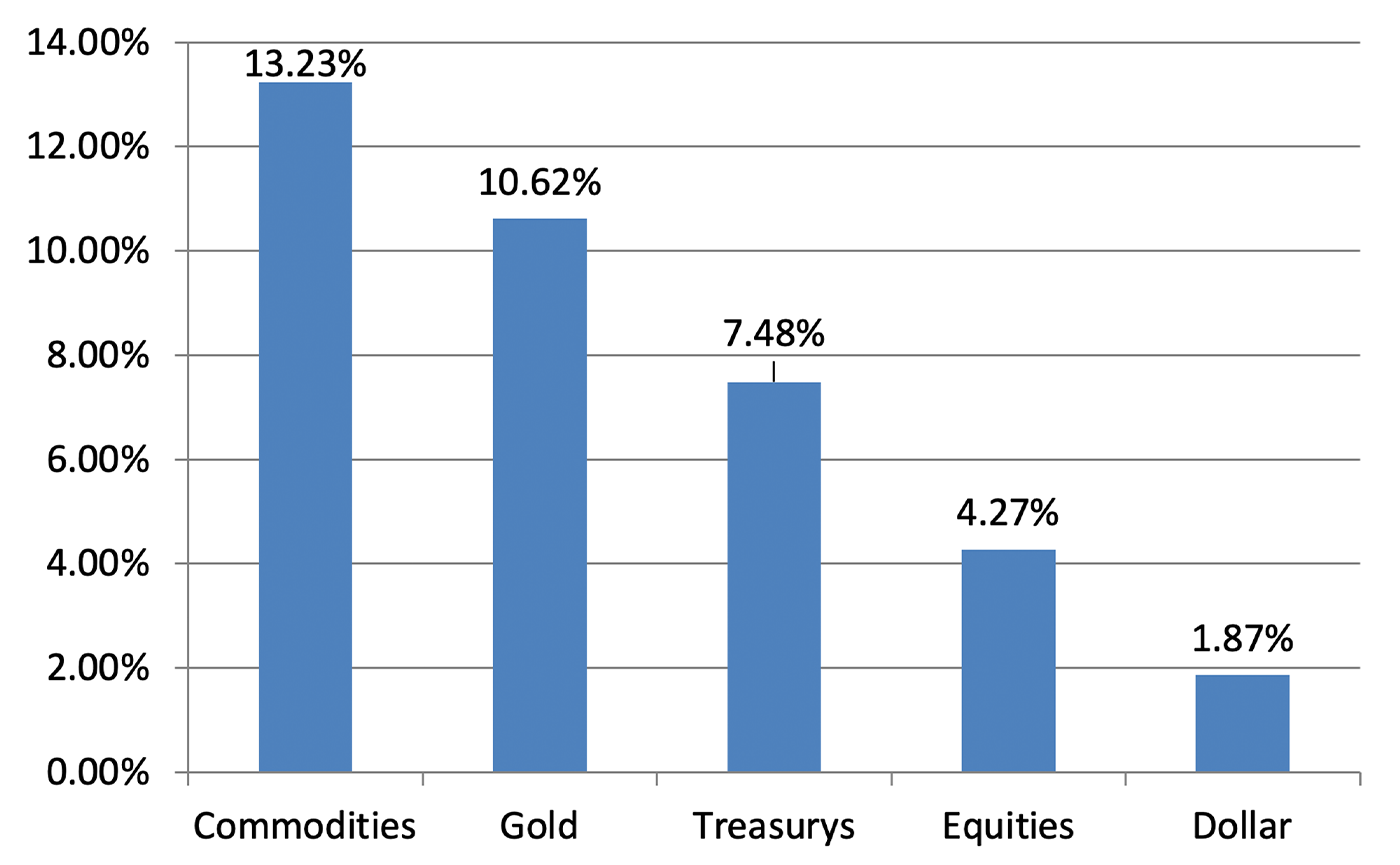
Here, we focus on periods of high—not merely rising—inflation, which we define as periods when inflation exceeds its average over the study period of 3.97%. Figure 7 summarizes how each major asset class fared during those periods.
FIGURE 7: PERFORMANCE OF VARIOUS ASSET CLASSES WHEN INFLATION IS HIGH (1973–2025)
Definition: The annualized rate of inflation is higher than 3.97% (the average for the study period).
Source: Flexible Plan Investments
This scenario resembles the previous one, with commodities leading and gold ranking second in performance. In times of rising or high inflation, gold—along with commodities—has been one of the best places to invest capital.
From April 2021 to May 2023, the U.S. experienced its first stretch of at least 12 consecutive months of above-average inflation since 1988–1991. During that period, annualized returns were 9.75% for commodities, 7.16% for gold, 5.33% for the dollar, 3.97% for equities, and -2.74% for Treasurys. Even in this modern flare-up, gold outperformed every core asset class except commodities, underscoring its value when prices run hot.
Scenario 7: Market volatility is high
High volatility is measured here as months when the VIX is in the top 20% of its historical range. Our study time frame for this scenario begins in 1990, the earliest point for which VIX data are available. Figure 8 shows how each asset class performed in those turbulent times.
FIGURE 8: PERFORMANCE OF VARIOUS ASSET CLASSES WHEN VOLATILITY IS HIGH (1990–2025)
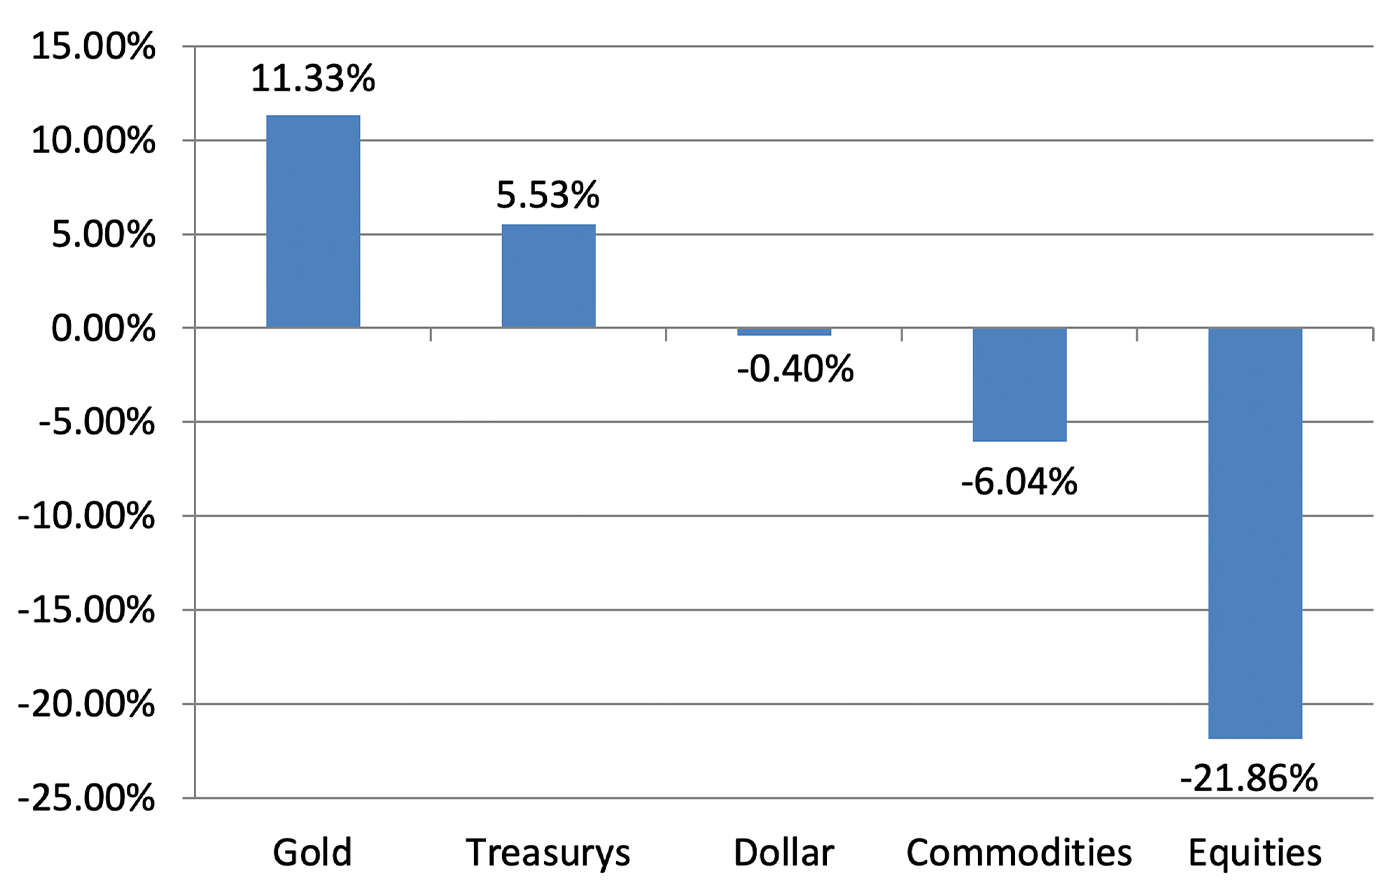
Definition: The VIX is in the top 20% of historical data.
Source: Flexible Plan Investments
Once again, gold was on top, with Treasurys a solid second—highlighting their shared role as crisis hedges when investors rush to safety.
One example was the COVID-19 market shock from February through June 2020. Over that span, annualized returns were 30.16% for gold, 10.71% for Treasurys, 0.00% for the dollar, -7.15% for equities, and -28.41% for commodities. Gold and Treasurys provided the only positive results, with gold the standout performer amid the market turmoil.
Scenario 8: U.S. economic-policy uncertainty is high
Gold has also provided portfolio value during times of elevated economic-policy uncertainty. This concern resurfaced in late 2024 and remains a key focus for investors.
We gauge that uncertainty using the monthly U.S. Economic Policy Uncertainty Index developed by Scott Baker, Nicholas Bloom, and Steven Davis. We classify a period as high when the reading is in the top 20% of the Index’s history dating to 1973. Figure 9 shows how each asset class performed in those time frames during our study period.
FIGURE 9: PERFORMANCE OF VARIOUS ASSET CLASSES WHEN U.S. ECONOMIC-POLICY UNCERTAINTY IS HIGH (1973–2025)
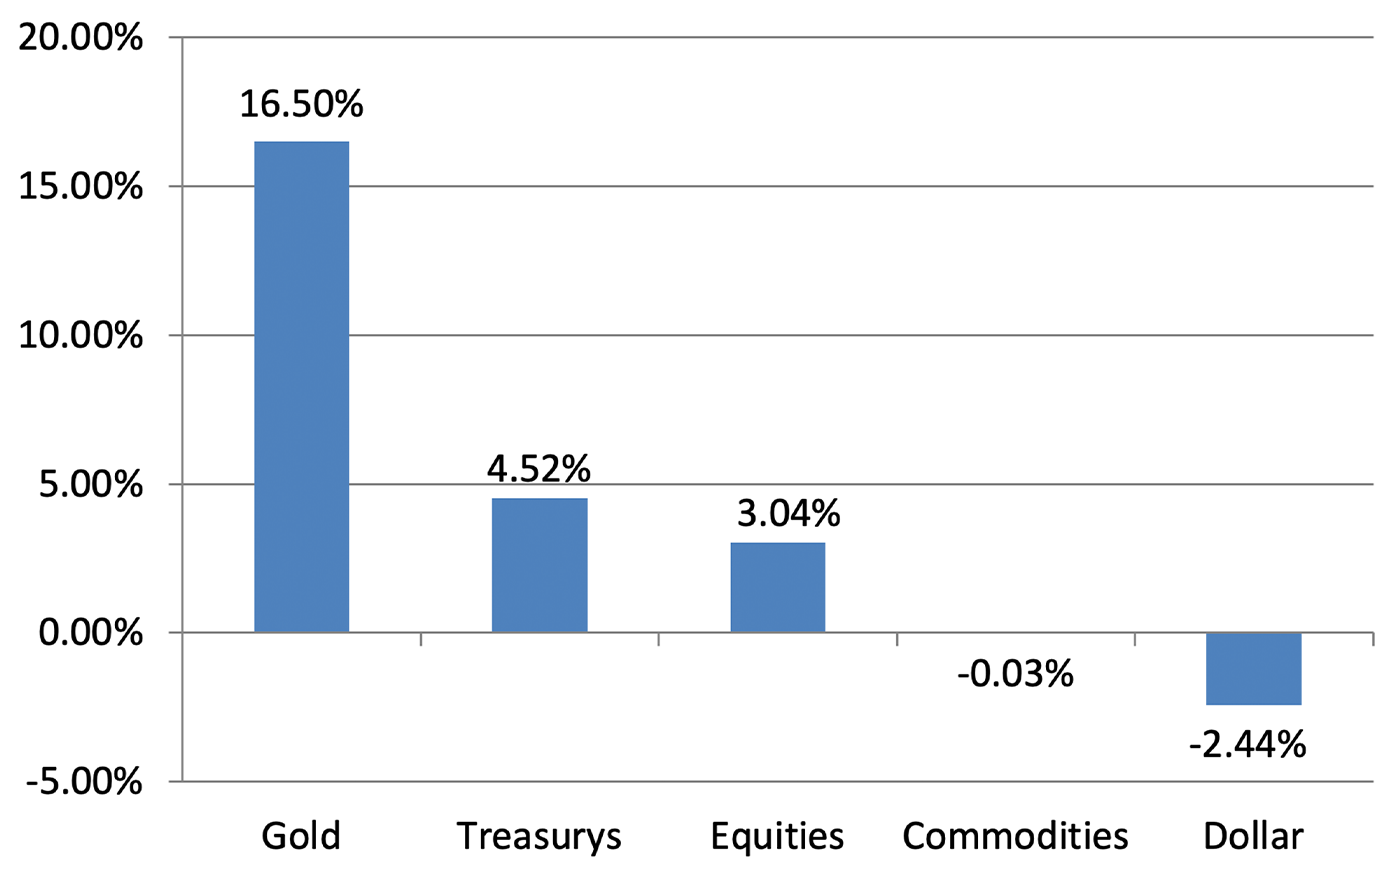
Definition: The monthly U.S. Economic Policy Uncertainty Index is in the top 20% of historical data.
Source: Flexible Plan Investments
Gold ranked first in these environments, consistent with its potential role as a safe haven.
From September 2008 to March 2009, at the height of the financial crisis, equities declined at an annualized rate of 54.37%. The U.S. dollar and gold were the best-performing asset classes, with annualized returns of 18.49% and 17.79%, respectively. During times of uncertainty, gold has been one of the best investment options available to guard against portfolio drawdowns.
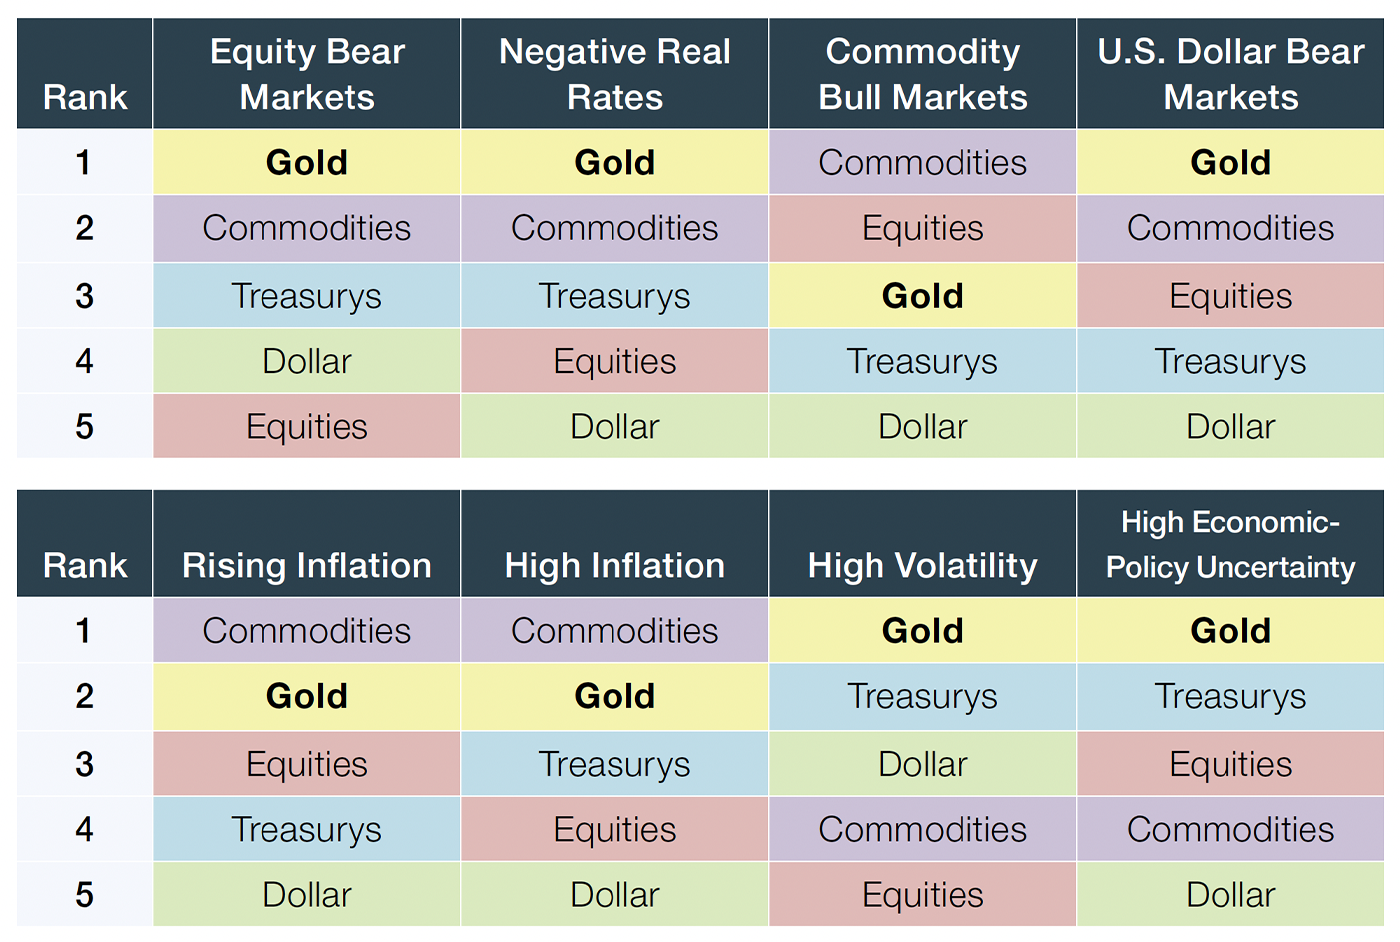
Performance rankings: Gold’s dominance across crisis scenarios
Here, we present the findings of our crisis-scenario analysis as a side-by-side ranking.
TABLE 2: ASSET-CLASS RANKINGS ACROSS EIGHT CRISIS SCENARIOS (1973–2025)
Source: Flexible Plan Investments
Seeing all eight scenarios together makes it easy to spot some compelling patterns in gold’s performance:
- Highest average ranking. Gold ranks first in five scenarios, second in two scenarios, and third in one scenario, giving it the most consistent average ranking of any asset over five decades—a record that turns gold from a “theoretical hedge” into a cycle-tested portfolio protector.
- Safer than the “safe haven”? Treasurys, long viewed as the default refuge, never take the top slot and reach second place only two times. Gold outperforms Treasurys in all eight scenarios, showing that bonds alone are not the most reliable safe-haven asset class.
- Edge over commodities. Commodities outperform gold in three scenarios but have a lower overall average ranking across all eight.
Performance insights
The performance rankings highlight four ways gold can strengthen a portfolio’s lineup of assets:
- Equity counterweight: When stocks struggled (equity bear markets, high volatility), gold delivered strong returns, acting as a true offset rather than merely a diversifier.
- Purchasing-power shield: Gold led during dollar bear markets and periods of negative real rates, preserving purchasing power when conventional currencies and fixed-income investments struggled.
- Uncertainty premium: Gold’s performance during spikes in market volatility or economic-policy uncertainty suggests it captures a premium when market participants face ambiguous future conditions—precisely when portfolio protection is most valuable.
- Consistency across crisis scenarios: Across all eight stress tests, gold stayed at or near the top, while the other asset classes moved more widely between leading and lagging—evidence of gold’s broad, consistent protection.
Portfolio implications
Our findings also support several actionable portfolio-construction principles:
- Baseline strategic allocation: Gold’s consistent performance across crises argues for a significant baseline allocation in most long-term investment portfolios.
- Complement to Treasurys: Both asset classes performed well during spikes in market volatility or economic-policy uncertainty, but gold also excelled in environments where bonds lagged. Holding both could be part of a comprehensive risk-management approach.
- Protection against unexpected risks: Gold’s strong showing during spikes in market volatility or economic-policy uncertainty suggests its value extends beyond hedging known risks; it may also add resilience against unpredictable or unprecedented market conditions.
- Tactical tool: Because gold’s performance benefits are different across crisis scenarios, tactical allocation adjustments based on market conditions could enhance gold’s already substantial portfolio benefits.
The performance rankings validate what many intuitive investors have long suspected: gold’s crisis alpha is real, demonstrated over multiple decades and across varied market environments. The evidence suggests that most conventional portfolios likely hold too little gold, given its ability to protect—and even enhance—risk-adjusted returns precisely when that protection is needed most.
Editor’s note: It is clear from the examples given here that gold can provide favorable returns and act as an important counterbalancing portfolio component under a variety of very specific market conditions.
But, how does gold perform under different classic economic regimes?
Part II of “The Role of Gold in Investment Portfolios” will examine this question in some detail. Part III will provide overall evidence-based conclusions surrounding optimal allocations to gold in a modern portfolio. Look for Part II and Part III in upcoming issues of Proactive Advisor Magazine.
The opinions expressed in this article are those of the author and the sources cited and do not necessarily represent the views of Proactive Advisor Magazine. This material is presented for educational purposes only.
This article presents an excerpt from the white paper “The Role of Gold in Investment Portfolios.” The complete paper—including a list of source data and disclosures—can be found here.
This white paper is provided for information purposes only. It should not be used or construed as an indicator of future performance, an offer to sell, a solicitation of an offer to buy, or a recommendation for any security. Flexible Plan Investments, Ltd., cannot guarantee any particular investment’s suitability or potential value. Information and data set forth herein have been obtained from sources believed to be reliable, but that cannot be guaranteed. Before investing, please read and understand Flexible Plan Investments, Ltd., ADV Part 2A and Part 3 (Form CRS) 1. Past performance does not guarantee future results. Inherent in any investment is the potential for loss as well as profit. A list of all recommendations made within the immediately preceding 12 months is available upon written request.
The original white paper, published by Flexible Plan Investments in November 2013, was written by David Varadi, David Wismer, and Jerry C. Wagner. The updated white paper, published in September 2026, was revised by Jerry C. Wagner and Daniel Poppe. flexibleplan.com
Since 1981, Flexible Plan Investments (FPI) has been dedicated to preserving and growing wealth through dynamic risk management. FPI is a turnkey asset management program (TAMP), which means advisors can access and combine FPI’s many risk-managed strategies within a single account. FPI’s fee-based separately managed accounts can provide diversified portfolios of actively managed strategies within equity, debt, and alternative asset classes on an array of different platforms. FPI also offers advisors the OnTarget Investing tool to help set realistic, custom benchmarks for clients and regularly measure progress. flexibleplan.com
RECENT POSTS

Aftermath of the ‘blue tsunami’

You’ve helped clients plan for retirement—but what about sabbaticals and ‘mini retirements’?
Inflation’s persistence puts the Fed under pressure to act

Addressing 13 important wealth-management issues for retirement clients