How gold can help in creating a more optimal portfolio allocation
How gold can help in creating a more optimal portfolio allocation

The role of gold in investment portfolios: Part II
Updated analysis supports an optimal portfolio allocation to gold of 17%.
Editor’s note: Flexible Plan Investments, a leading provider of dynamically risk-managed investment strategies, first authored an extensive analysis of the role of gold in investment portfolios in 2013 and has provided periodic updates. The white paper has been recently updated in 2024 and is being presented as a guest commentary in two parts in Proactive Advisor Magazine. Part I examined broad issues related to how an investment in gold performed in specific market environments.
We are pleased to present Part II here, which looks more closely at gold’s performance in classic market regimes and offers broad conclusions on optimal gold allocations for investment portfolios. This analysis suggests an optimal gold allocation of 17%, which produced higher risk-adjusted returns than any other portfolio alternative.
Performance of gold in different economic regimes
It is clear from the examples and analysis presented in Part I that gold can provide favorable returns and act as a critical counterbalancing portfolio component under specific market and economic conditions that worry investors. But how does gold perform under different classic economic regimes?
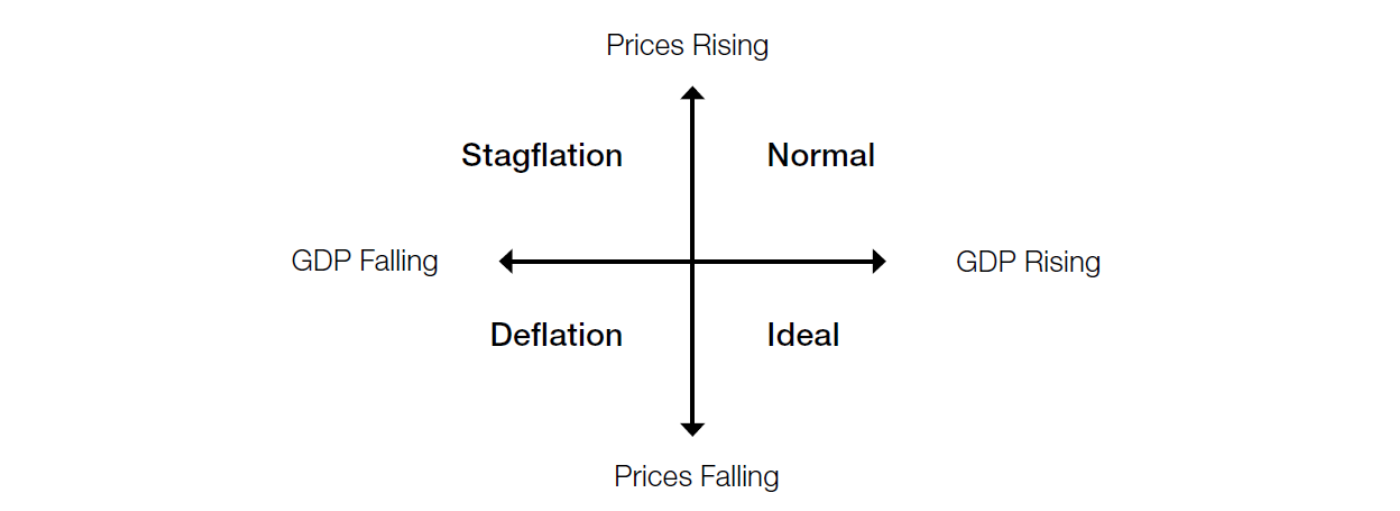
A popular concept in modern portfolio theory is the “All-Weather” approach to economic regime investing, as discussed by Bridgewater. This approach identifies four different “states of the world,” characterized by rising or falling inflation/prices and rising or falling economic activity. Figure 9 provides a conceptual image of these regimes.
FIGURE 9: ECONOMIC REGIMES
Sources: Flexible Plan Investments, adaptation of All Weather chart by Bridgewater Associates
In our analysis, we considered the different environments characterized by these changes in both prices and economic activity and then adopted Bridgewater’s identifying labels:
- “Normal”: Real economic activity (real GDP) is rising, and prices (CPI) are rising.
- “Ideal”: Real economic activity (real GDP) is rising, and prices (CPI) are falling.
- “Stagflation”: Real economic activity (real GDP) is falling, and prices (CPI) are rising.
- “Deflation”: Real economic activity (real GDP) is falling, and prices (CPI) are falling.
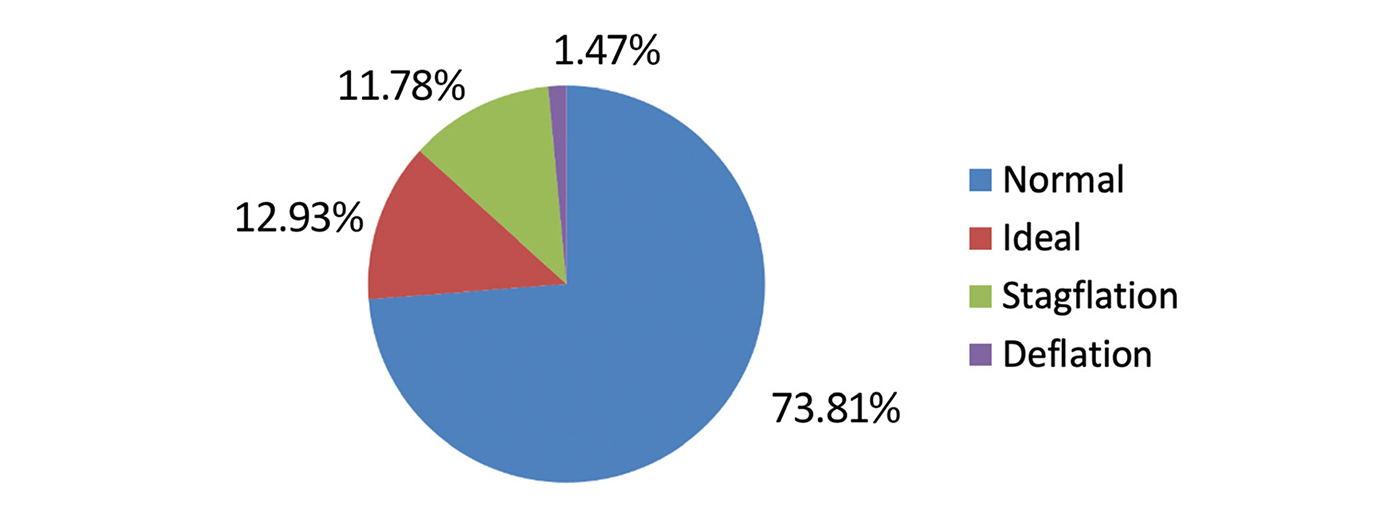
We classified periods of unchanged data as belonging to the rising camp. Figure 10 shows the relative frequency of these different economic regimes over the time frame of our study. As you can see, the most frequently occurring economic state (73.81%) was “Normal,” characterized by rising economic activity and prices. Given the consistent efforts of central banks worldwide to maintain low inflation rates and the perpetual pursuit of economic growth by governments and private industries, such a high percentage is unsurprising.
FIGURE 10: HISTORICAL FREQUENCY OF DIFFERENT ECONOMIC REGIMES (1973–2023)
Source: Flexible Plan Investments
In contrast, the extreme opposite situation, “Deflation,” has occurred relatively infrequently (1.47%). Deflation is a destructive situation in which economic activity and prices are falling. Japan serves as a modern case study of the deleterious effects of this environment. Governments generally attempt to avoid this situation at all costs, even if that means printing money and risking an overshoot into higher-than-desired inflation levels.
“Stagflation” occurs when prices rise and economic activity falls. It has occurred just under 12% of the time. The most notable example of this regime occurred during the 1970s and early 1980s when prices increased amid economic strain. We returned to this condition in the first half of 2022.
Finally, “Ideal” conditions exist when prices fall, but economic activity is robust and rising. This regime was present just under 13% of the time. Such periods are an excellent environment for business expansion and for investors in many asset classes. While not continuous, “Ideal” conditions existed for many months between 2011 and 2015.
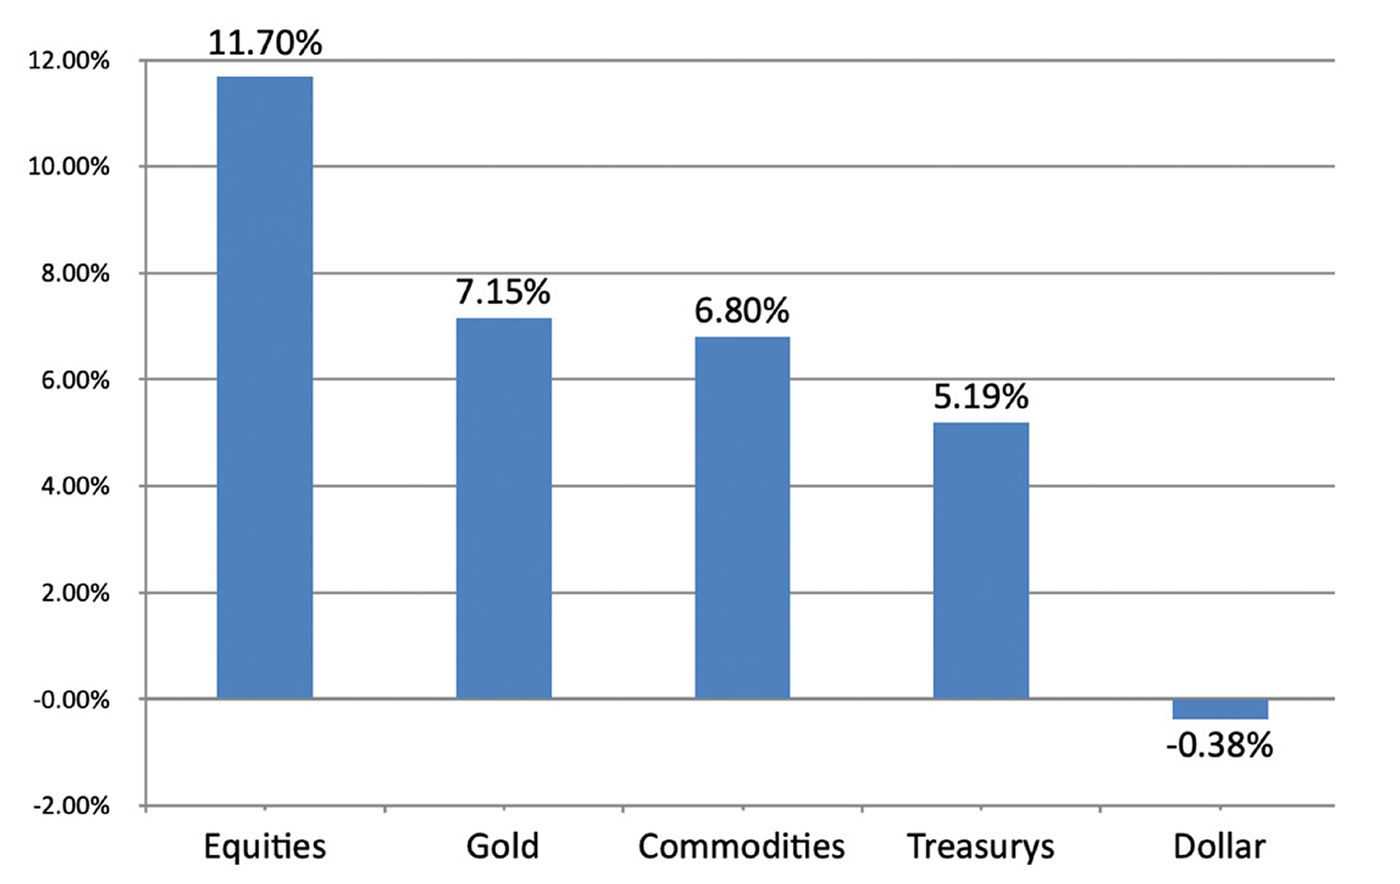
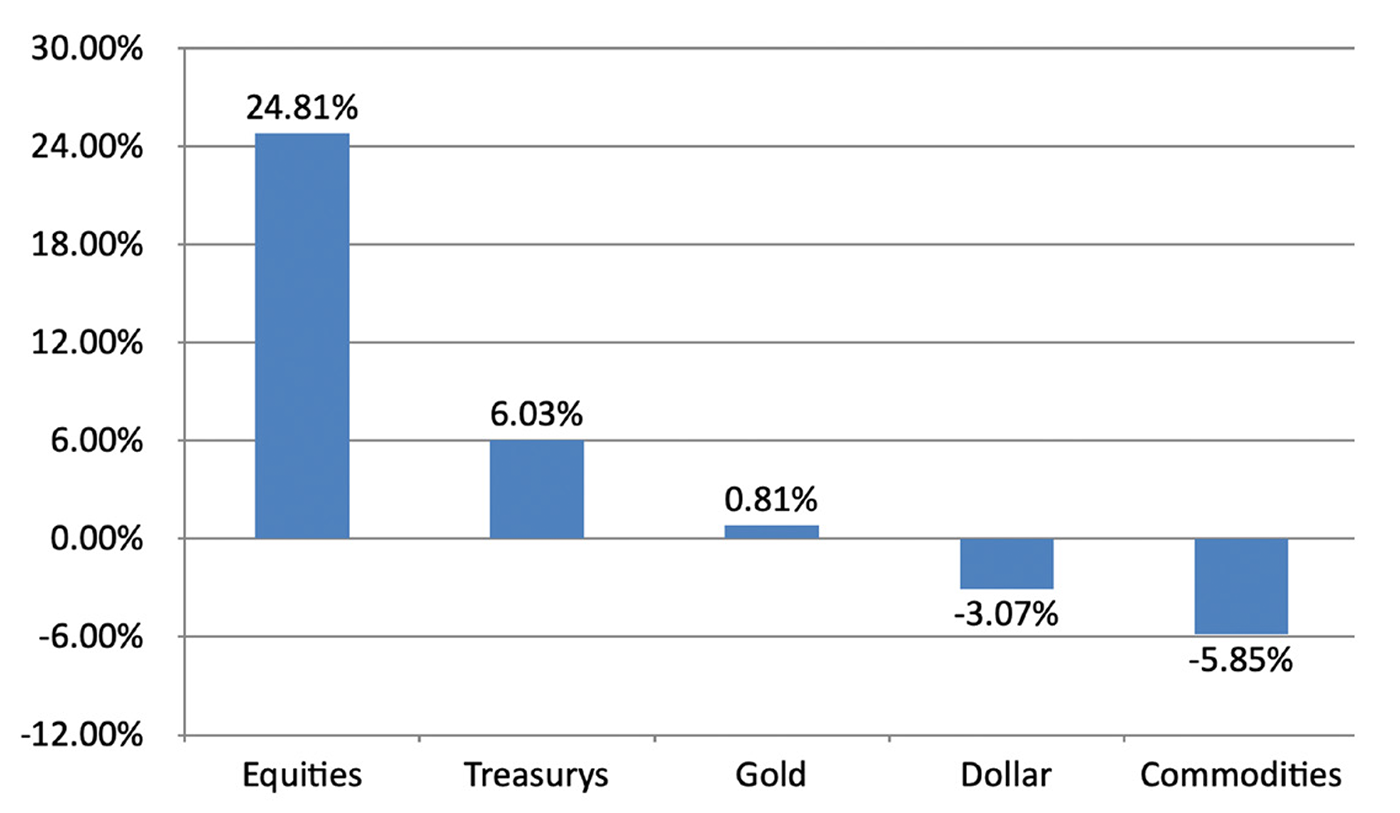
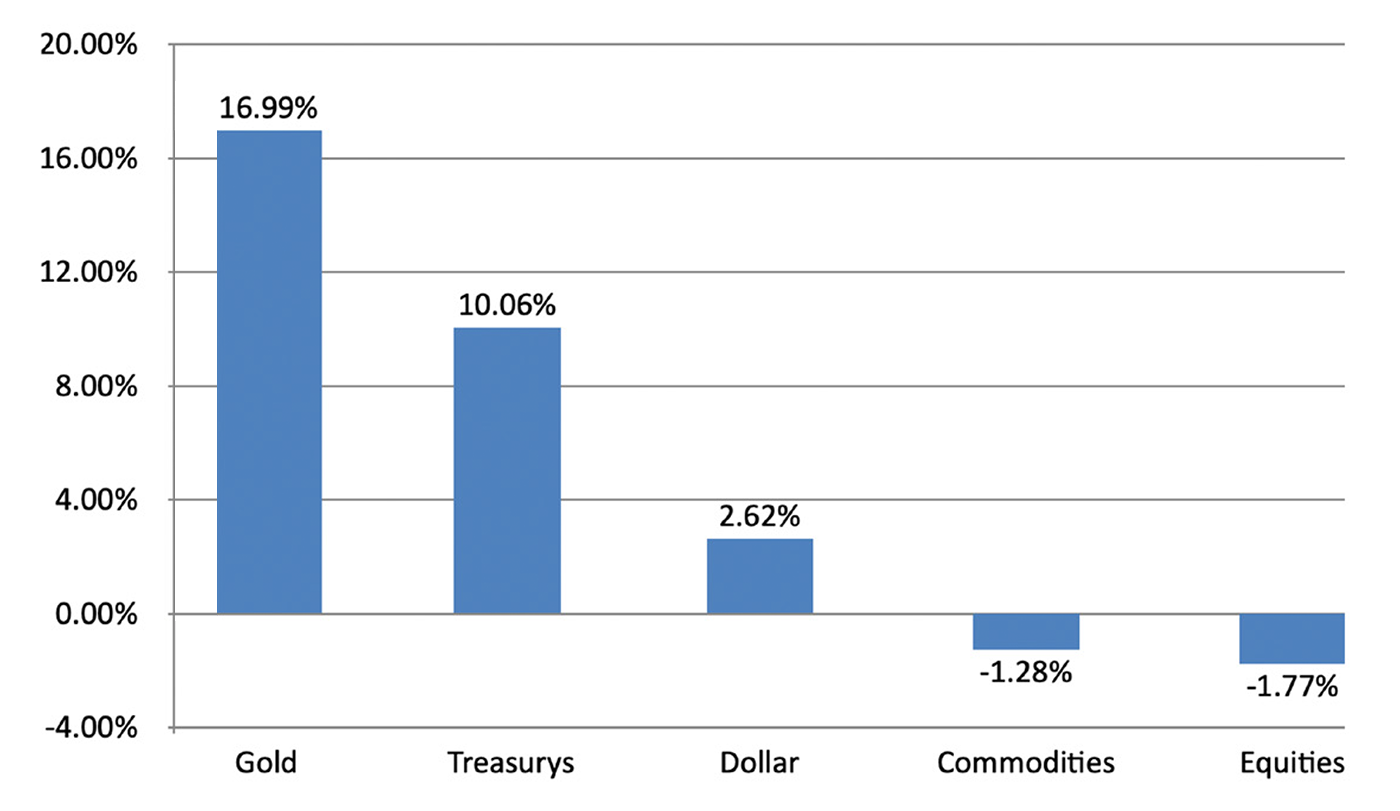
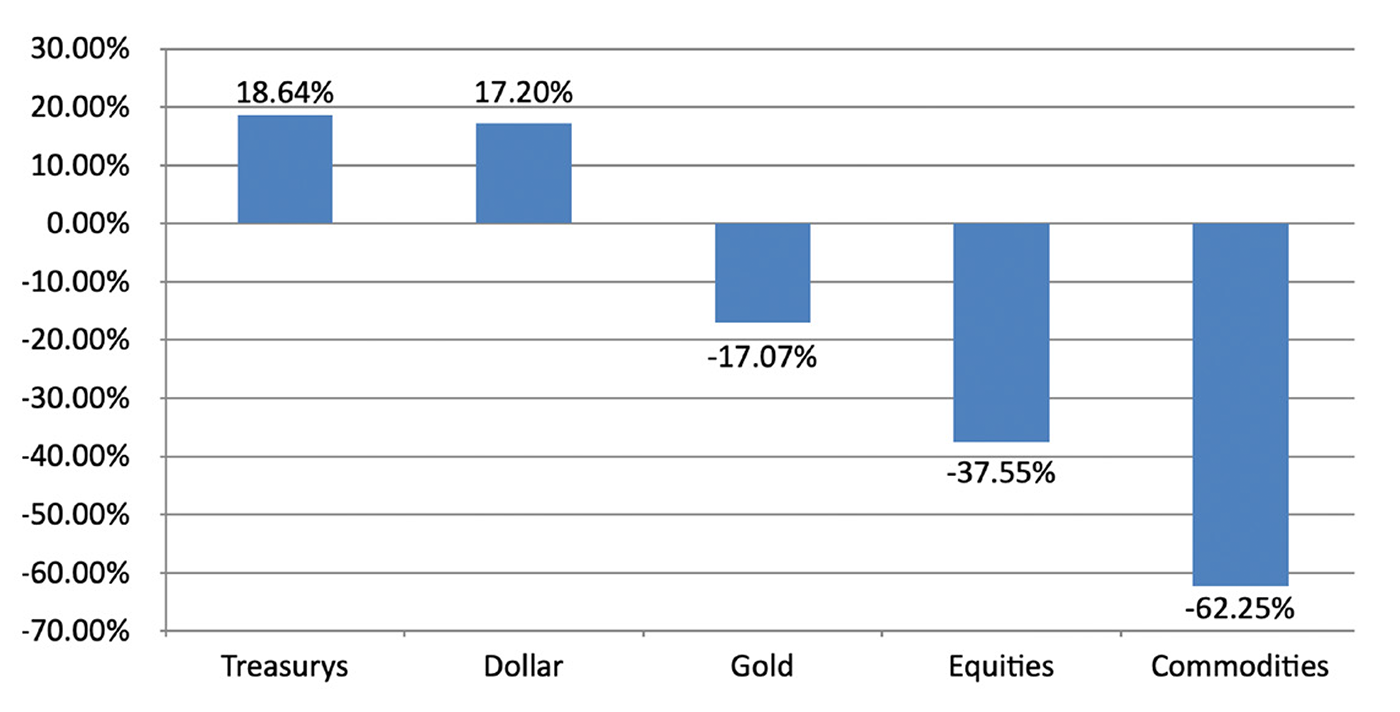
Figures 11 through 14 summarize the performance of our previously referenced asset classes during each of these economic regimes.
FIGURE 11: PERFORMANCE OF VARIOUS ASSET CLASSES IN “NORMAL” ECONOMIC CONDITIONS (1973–2023)
Source: Flexible Plan Investments
FIGURE 12: PERFORMANCE OF VARIOUS ASSET CLASSES IN “IDEAL” ECONOMIC CONDITIONS (1973–2023)
Source: Flexible Plan Investments
![]() Related Article: Successful advisors on the top benefits of outsourced investment management
Related Article: Successful advisors on the top benefits of outsourced investment management
FIGURE 13: PERFORMANCE OF VARIOUS ASSET CLASSES IN “STAGFLATION” ECONOMIC CONDITIONS (1973–2023)
Source: Flexible Plan Investments
FIGURE 14: PERFORMANCE OF VARIOUS ASSET CLASSES IN “DEFLATION” ECONOMIC CONDITIONS (1973–2023)
Source: Flexible Plan Investments
Several takeaways from this analysis are pertinent to gold:
- In the most commonly occurring “Normal” economic conditions, gold finished second to equities in annualized returns.
- During “Ideal” conditions, equities performed the best.
- In times of “Stagflation,” gold outperformed the other asset classes.
- Gold ranks in the top three among the asset classes across all regimes.
- While gold significantly underperformed equities during “Ideal” conditions, its annualized gain of 16.99% versus a loss of 1.77% for equities during times of “Stagflation” is a compelling statistic.
- Deflation was the worst of times for gold, although it still outperformed commodities and equities.
This performance further reinforces the case for gold as a vital portfolio diversifier. During Stagflation and Normal conditions, which occurred roughly 86% of the time during the study, gold ranked first and second in performance, respectively. While gold may not outperform equities in Normal times, it has dramatically outperformed equities during periods of market stress, high inflation, and other scenarios. Because gold can perform when equities struggle, it can also significantly improve long-term portfolio volatility.
The role of gold in
investment portfolios
This two-part guest commentary
by Flexible Plan Investments explores
why investors should reconsider
their portfolio’s allocation to gold.
Part I: Understanding gold’s performance under different market scenarios
Gold as a diversifier versus other asset classes
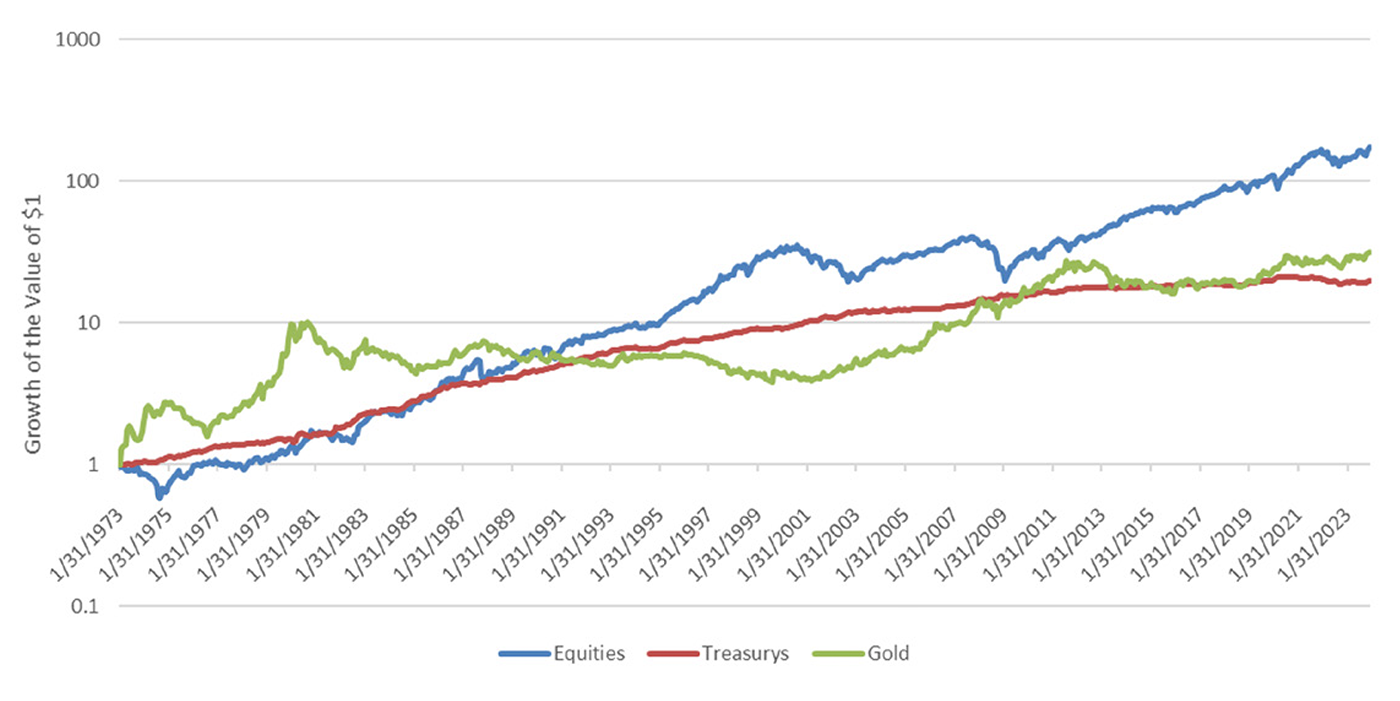
The analysis illustrates that gold can offer diversification in several different economic regimes, but how does gold correlate with traditional asset classes such as stocks and bonds?
As Figure 15 shows, gold has maintained a low correlation with stocks and bonds and has not moved in tandem with traditional asset classes.
FIGURE 15: GOLD VS. STOCKS VS. BONDS (1973–2023)
Source: Flexible Plan Investments
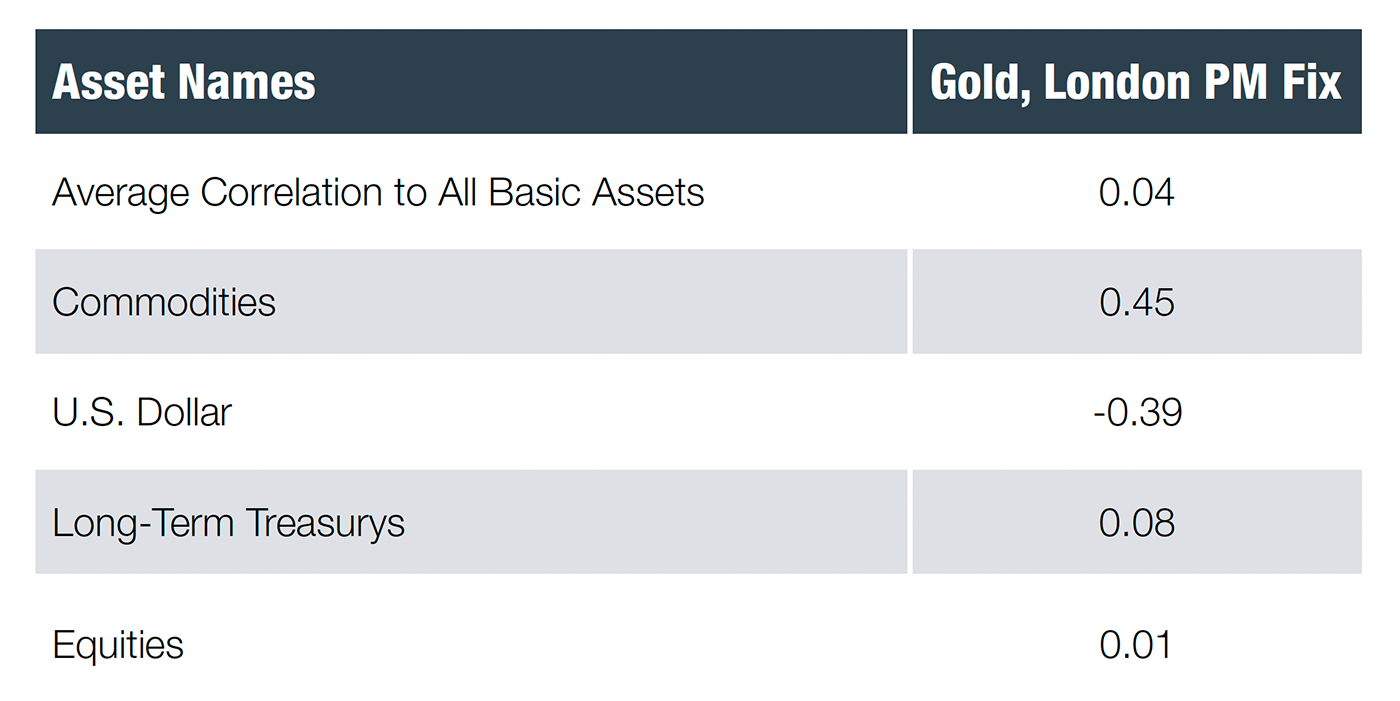
One of the statistical measures used to gauge this relationship is the correlation coefficient, which ranges between 1 and -1. A coefficient of 1 indicates that the assets move in perfect tandem, while -1 suggests that the assets move in an opposite or alternating fashion. Table 1 shows gold’s correlation with some basic institutional asset classes.
TABLE 1: GOLD AS A DIVERSIFIER—CORRELATION MATRIX FOR BASIC ASSETS (1973–2023)
Source: Flexible Plan Investments
The highest absolute correlation gold had with any other asset class was 0.45, indicating a low to moderate relationship with all other basic asset classes. Commodities, which contains gold itself, had the highest correlation. Unsurprisingly, the second-strongest relationship, albeit negative, is between gold and the U.S. dollar. Investors price gold relative to the value of the dollar. Gold becomes more valuable when the dollar’s value decreases, and vice versa. Gold had virtually no correlation to stocks and bonds. Gold has been an excellent diversifier for a basket of basic institutional asset classes.
Capturing exposure to gold in an investment portfolio
For investors seeking exposure to gold in their portfolio, gold mining stocks, or shares of companies that primarily mine gold ore, offer a potential avenue. However, while the fortunes of these companies are tied to the price of gold, they are also influenced by operational costs and other business factors specific to each gold miner. Consequently, the return on gold itself and the gold mining companies’ index can diverge significantly.
Gold prices and the returns of gold mining stocks have a positive relationship: When the price of one rises, so does the other’s. However, the extent to which they move in tandem is worth analyzing.
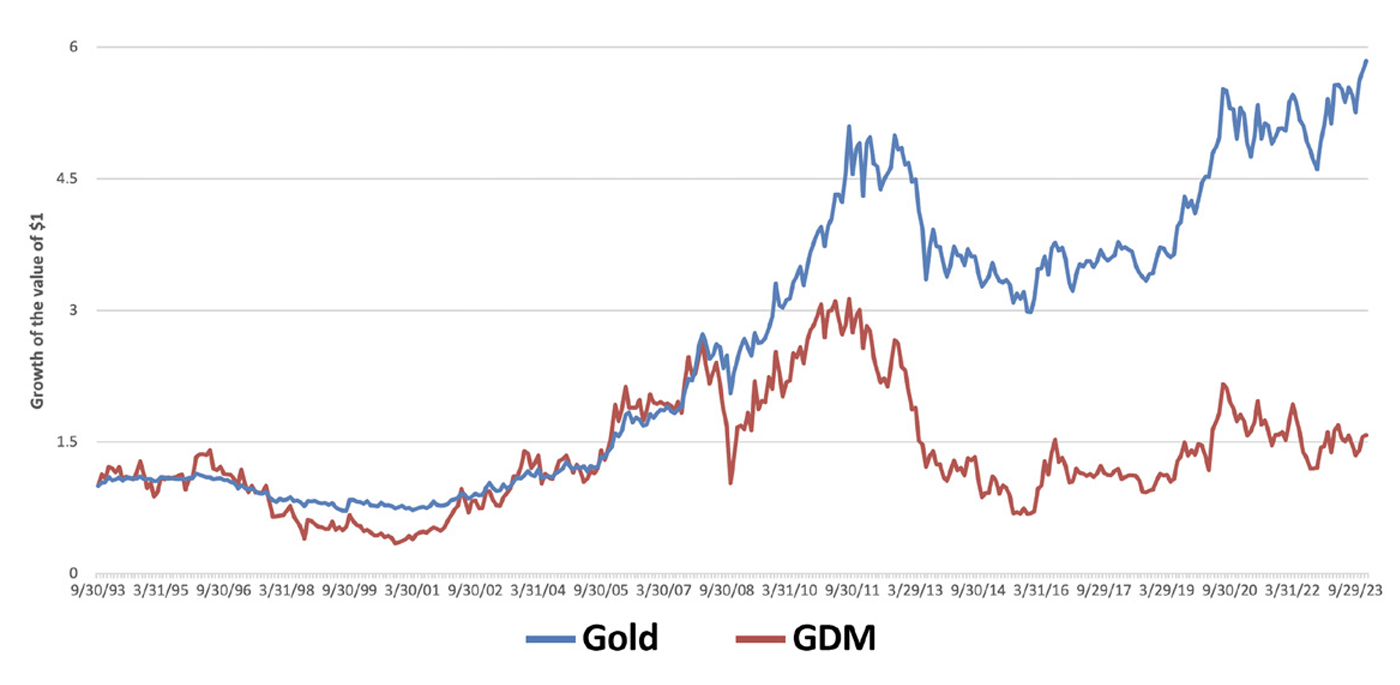
From 1993 to 2023, the correlation between gold and the NYSE Arca Gold Miners Index was 0.77, indicating a high but imperfect correlation. Yet, a review suggests that the relationship between the Gold Miners Index and the price of gold may be weaker than this figure implies, for returns over the same period were drastically different. Figure 16 illustrates the growth of one dollar from 1993 (when the Gold Miners Index starts) to 2023 of an investment in gold and the Gold Miners Index.
FIGURE 16: GOLD PRICE VS. GOLD MINERS INDEX (GDM)
Source: Flexible Plan Investments
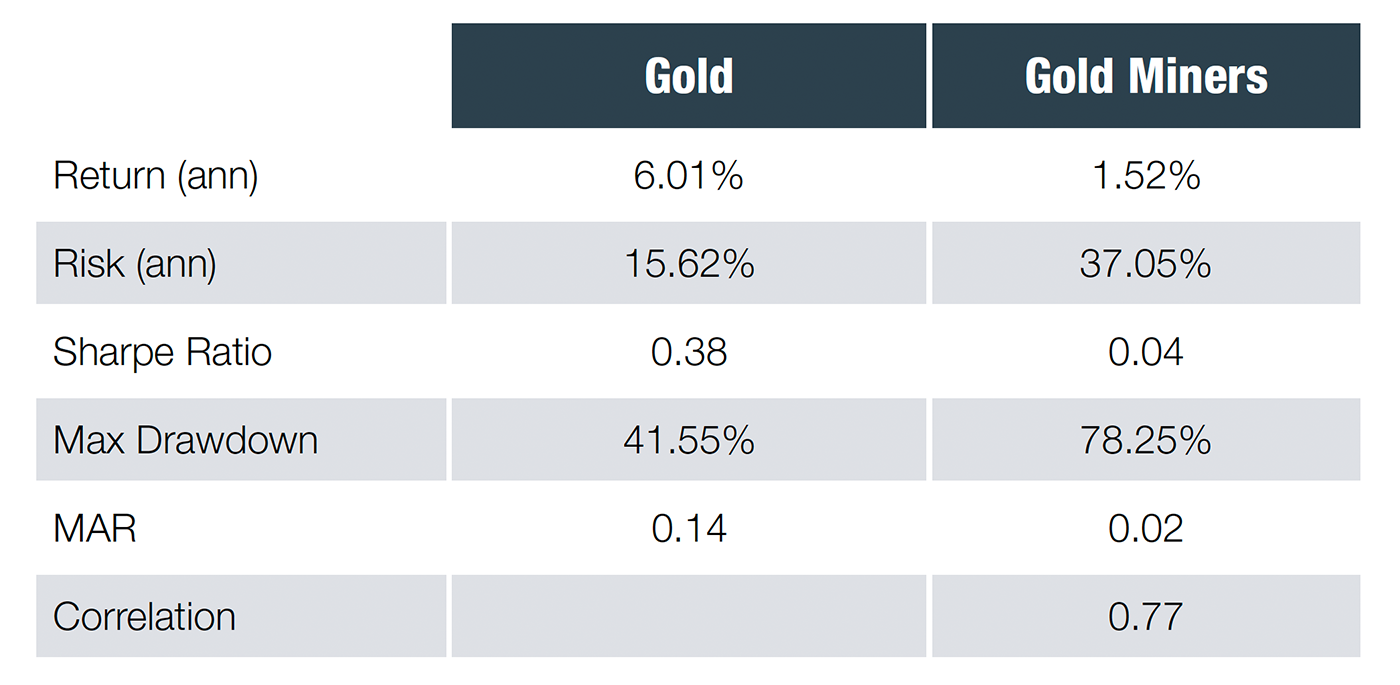
Over three decades, gold has been the more successful of the two. Table 2 presents several statistics for observing risk and return in a portfolio context. The table shows how much more beneficial it has been to hold gold over the Gold Miners Index.
TABLE 2: GOLD SPOT VS. GOLD MINERS INDEX—STATISTICS (1993–2023)
Source: Flexible Plan Investments
While incorporating exposure to gold mining stocks in an investment portfolio may enhance diversification, gold’s stand-alone performance vastly outshines that of gold mining stocks over the past three decades. Compared to gold mining stocks, gold has less than half the annualized risk and an annualized return that is more than four percentage points higher than gold mining stocks over 30 years. This analysis makes gold the clear choice to hold in a portfolio.
Optimal portfolio allocations to gold
The World Gold Council released a study in 2022 that showed that institutional investors have embraced alternative investments to achieve better diversification, and gold has benefited from this shift. The study claims that global investment demand has grown, on average, 10% annually. The study adds, “Our analysis illustrates that adding between 4% and 15% in gold to hypothetical average portfolios over the past decade, depending on the composition and the region, would have increased risk-adjusted returns.”
But has gold boosted risk-adjusted returns for a more typical portfolio? What has the optimal allocation to gold been for such a portfolio? These are more practical questions than finding the optimal allocation across a broad universe of asset classes more commonly held in large pension portfolios.
First, let’s define “typical”: A very commonly cited portfolio contains a 60% allocation to equities and a 40% allocation to bonds, or what the literature might call a traditional “balanced portfolio.”
We’ll use this typical portfolio to test gold’s potential diversification benefits and allocate varying percentages to gold to determine if we can improve risk-adjusted returns. The portfolio will include stocks represented by the Standard and Poor’s 500 Index, while bonds will be represented by the Bloomberg U.S. Intermediate Treasury Bond Index.
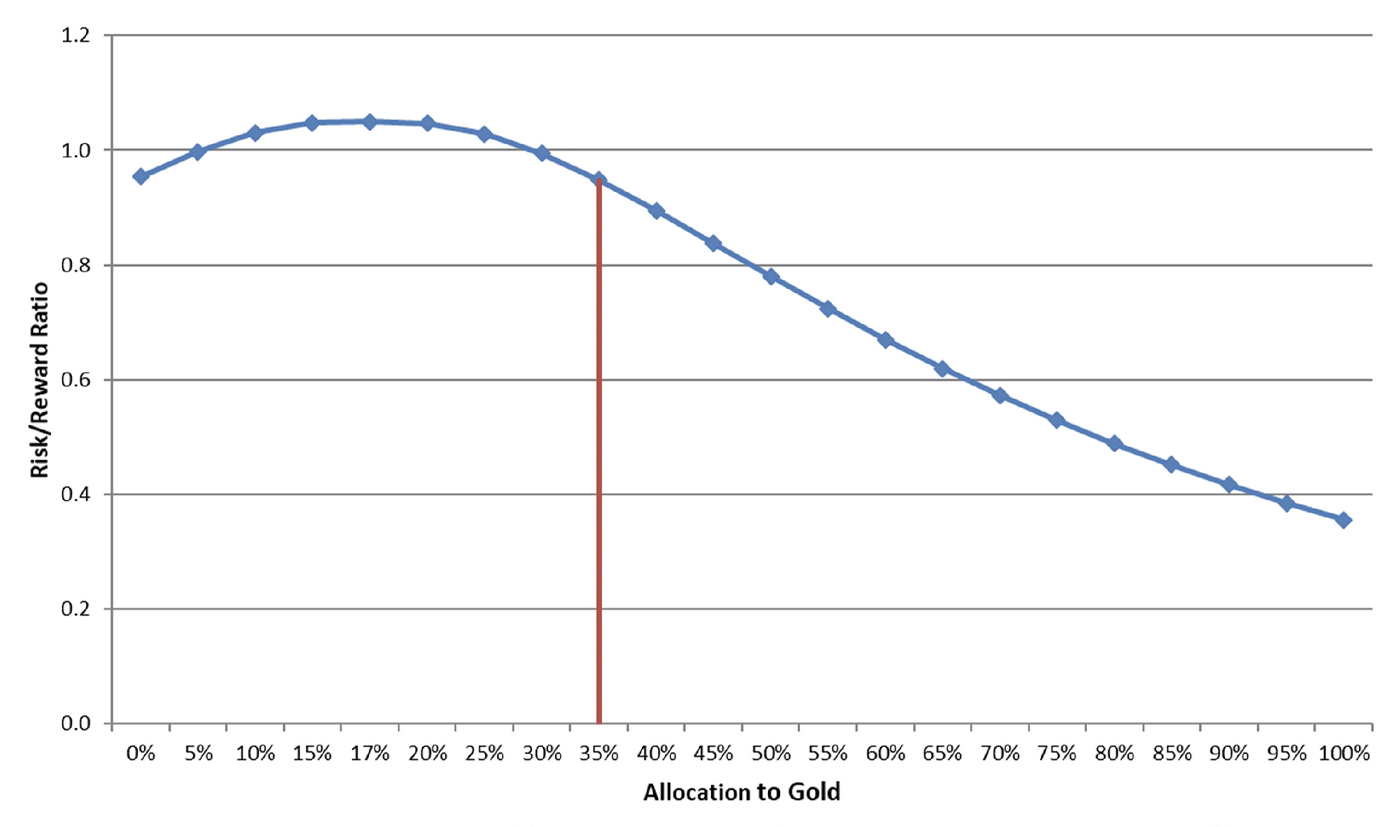
Figure 17 shows the risk-adjusted return ratio (Sharpe ratio) relative to the allocation to gold from 1973 to 2023. For reference, a balanced portfolio consisting of 60% stocks and 40% bonds has a Sharpe ratio of 0.953 over that time.
FIGURE 17: RISK-REWARD RATIO RELATIVE TO THE ALLOCATION TO GOLD FOR A BALANCED INVESTOR (1973–2023)
Source: Flexible Plan Investments
The first “dot” represents a balanced portfolio. Therefore, all the other dots to the left of the vertical line represent portfolios that dominate a balanced portfolio in terms of risk-adjusted returns. In finance parlance, these portfolios lie on the “efficient frontier.”
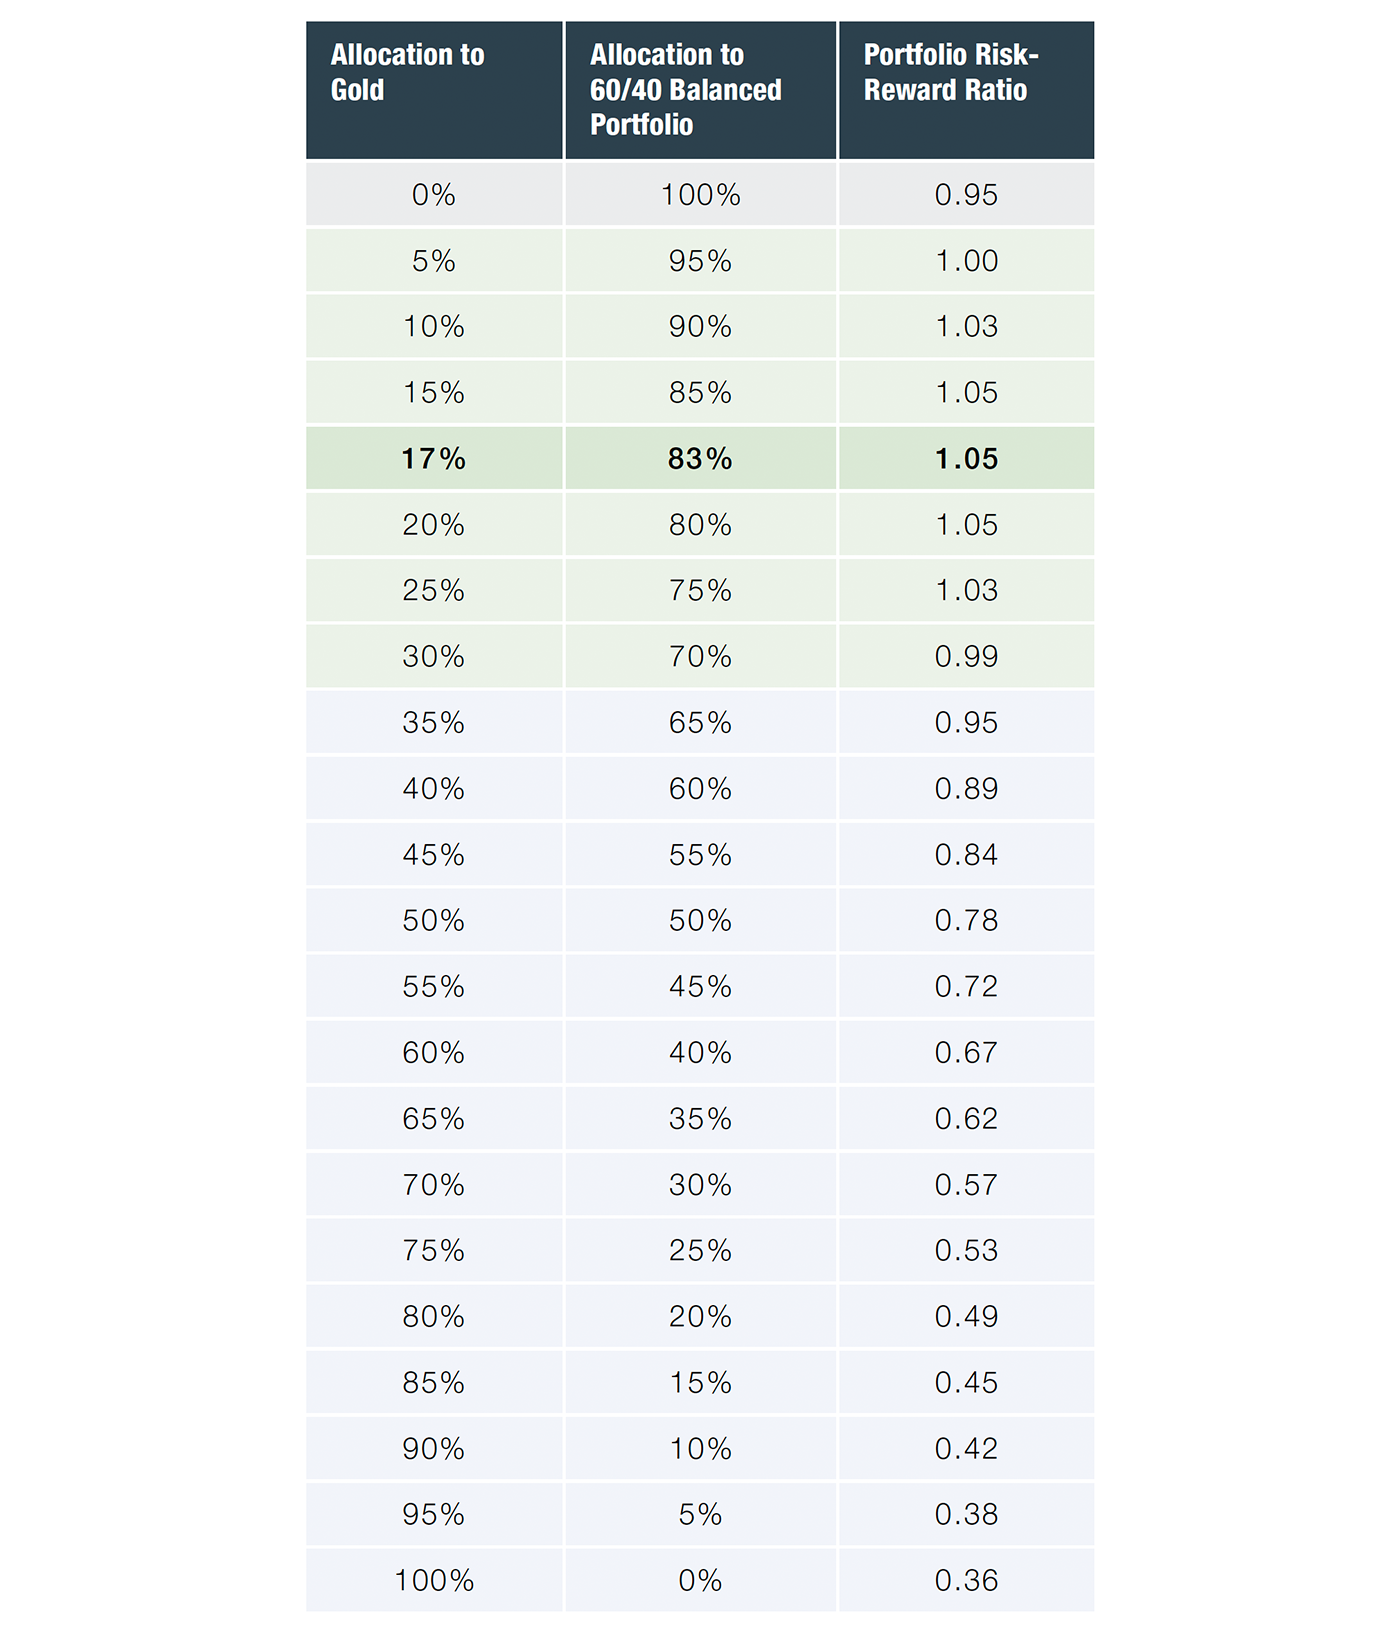
Table 3 offers a more detailed breakdown, presenting data points for various allocation levels to gold and the resulting total portfolio risk-reward ratio. Every portfolio with allocations to gold ranging from 1% to 34% has outperformed a traditional balanced portfolio in terms of risk-reward ratio.
Table 3 shows that it has been possible to allocate as much as 34% to gold in a portfolio while still maintaining a superior risk-reward ratio compared to a “balanced” portfolio. It also shows that the optimal allocation from a risk-reward standpoint has been to invest 17% in gold and 83% in a balanced portfolio.
TABLE 3: RISK-REWARD RATIOS OF PORTFOLIOS WITH DIFFERENT ALLOCATIONS TO GOLD AND A BALANCED PORTFOLIO
Source: Flexible Plan Investments
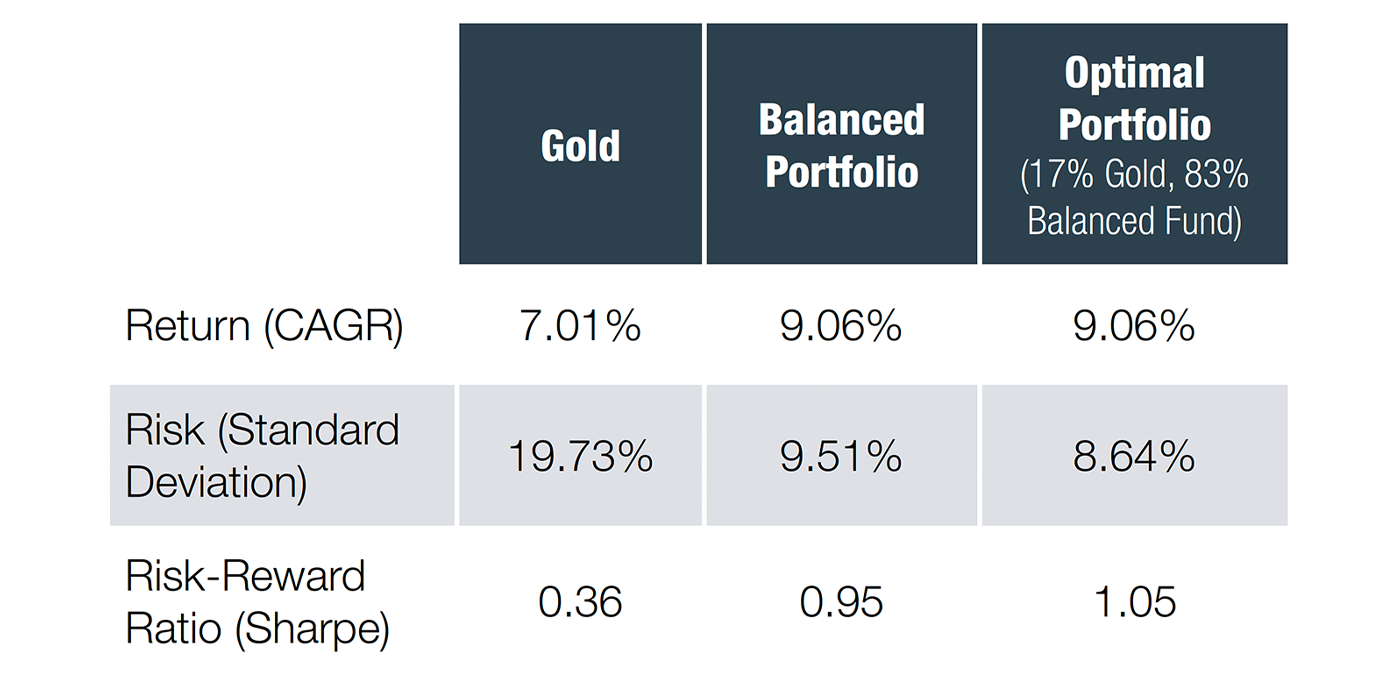
Table 4 compares this “optimal portfolio” with gold and a balanced portfolio.
TABLE 4: GOLD VS. A BALANCED PORTFOLIO VS. AN “OPTIMAL PORTFOLIO”
Source: Flexible Plan Investments
Table 4 reveals that this optimal portfolio, which includes gold, delivers the same return as the balanced portfolio, with lower risk on an annualized basis and a higher risk-adjusted return than either the “gold-only portfolio” or the traditional “balanced portfolio.”
In 2022, many market commentators declared the balanced portfolio dead. This proclamation stemmed from the simultaneous decline of stocks and bonds as the Federal Reserve turned hawkish following a surge in inflation. Unlike in most instances, bonds and stocks failed to hedge each other and suffered drawdowns concurrently. Therefore, it is noteworthy that the traditional balanced portfolio (as defined above) incurred a drawdown of 18.04% for the year, while the optimal portfolio had a drawdown of 16.15%, offering investors additional protection in that environment.
Replacing bonds with gold in a 60/40 portfolio
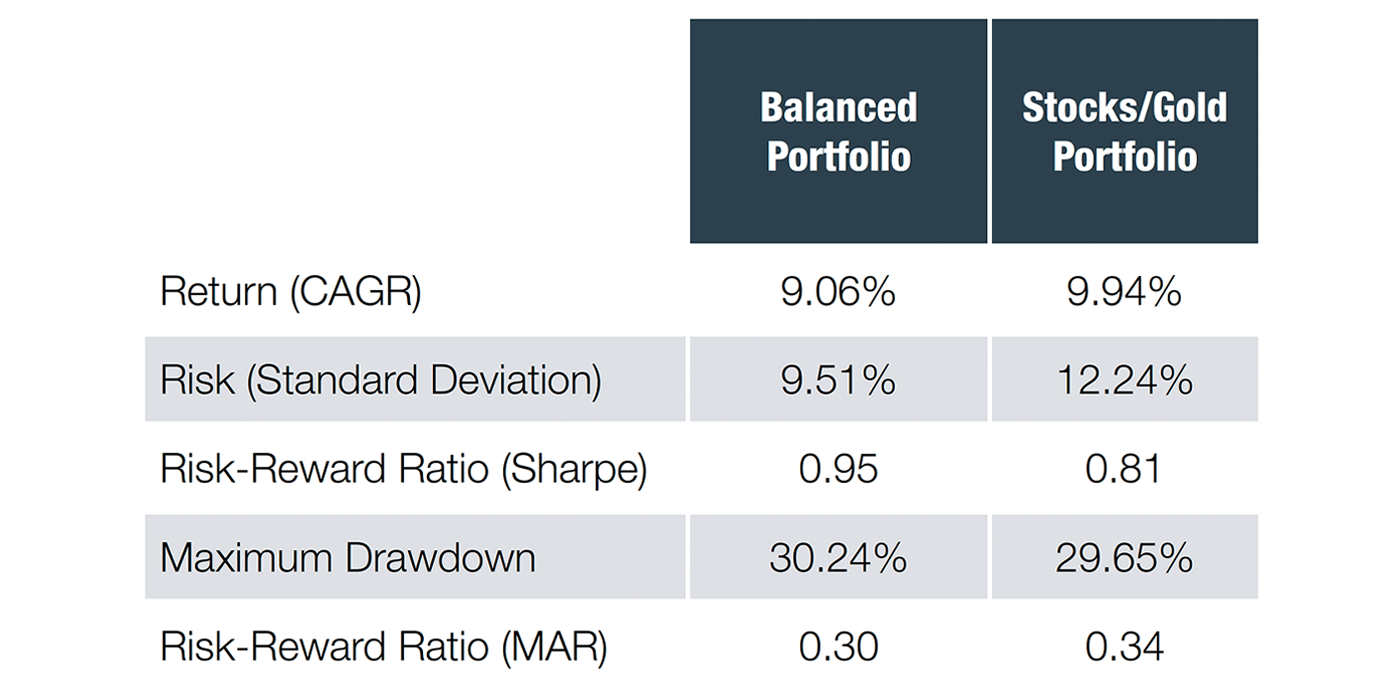
Considering gold’s beneficial role in a portfolio of stocks and bonds, we wondered what it might look like if you replaced your entire bond exposure with gold. We compared the performance since 1973 of a portfolio of 60% stocks and 40% gold to a traditional balanced portfolio of 60% stocks and 40% bonds (Table 5).
TABLE 5: “TRADITIONAL BALANCED PORTFOLIO” VS. “STOCKS/GOLD PORTFOLIO”
Source: Flexible Plan Investments
While the Sharpe ratio is lower for the stocks/gold portfolio, it also has a higher MAR risk-reward ratio due to its higher return and lower maximum drawdown. The resulting portfolio is quite competitive with the traditional balanced portfolio, all without the use of any bond exposure. Returns (CAGR) are almost 1% higher annually, and the maximum drawdown during the 50-year test was lower than that of the traditional stock-bond combination.
Concluding thoughts on the evidence
Our study demonstrates that adding gold to a typical balanced portfolio has been beneficial across a wide range of allocations to boost risk-adjusted returns. Over the period studied, the optimal allocation in a balanced portfolio has been 17% to gold and 83% to a balanced portfolio, representing a result of roughly 50% stocks, 33% bonds, and 17% gold. Based on the historical analysis, investors could have allocated as much as 34% to gold and still placed higher on the frontier of efficient portfolios than a purely balanced portfolio.
Contrary to the common 5% rule-of-thumb allocation recommended by many financial advisers, our findings suggest a higher potential for gold allocation. This perspective aligns with notable financial literature, such as Harry Browne’s “Permanent Portfolio,” which advocates equal weighting (25%) across stocks, bonds, cash, and gold as optimal across different economic regimes. We believe the evidence presented in this white paper strongly suggests that the prevailing “conventional wisdom” dramatically understates the potential role of gold in portfolios for a typical investor over the long term.
Every investor should reconsider their portfolio’s current allocation to gold
Gold offers several broad benefits over the long term: (a) ongoing marketplace demand in the face of limited supply; (b) historic protection from extreme market volatility, high periods of inflation, and a depreciating dollar; (c) a time-tested component of portfolio diversification; and (d) liquidity and versatility in terms of the many forms of ownership possible for an investor.
Our analysis spanning five decades demonstrates that gold remains a pivotal asset in modern investment strategies. Empirical evidence strongly supports its role as a significant diversifier and a robust performer during economic stress. Our study indicates that portfolios integrating gold with up to 34% allocations outperform traditional balanced portfolios, particularly for risk-adjusted returns. These findings contradict the conservative conventional wisdom that limits gold’s presence in portfolios.
Amid ongoing shifts in the global economic landscape, marked by geopolitical tensions, monetary policy changes, and periods of high inflation, gold’s importance seems only poised to grow. Financial advisers and professional investors should reassess their portfolios and potentially increase their allocations to gold, acknowledging its proven ability to enhance returns and reduce portfolio volatility over extended periods.
Investors seeking to hedge against market and economic uncertainties should consider a more substantial allocation to gold, leveraging its historical resilience and strategic value as a diversifying asset. This strategic shift could help safeguard investments during turbulent times and tap into the potential for superior long-term growth with greater risk-adjusted returns.
The opinions expressed in this article are those of the author and the sources cited and do not necessarily represent the views of Proactive Advisor Magazine. This material is presented for educational purposes only.
This article presents an excerpt from the white paper “The Role of Gold in Investment Portfolios.” The complete paper—including a list of source data—can be found here.
This white paper is provided for information purposes only. It should not be used or construed as an indicator of future performance, an offer to sell, a solicitation of an offer to buy, or a recommendation for any security. Flexible Plan Investments, Ltd., cannot guarantee any particular investment’s suitability or potential value. Information and data set forth herein have been obtained from sources believed to be reliable, but that cannot be guaranteed. Before investing, please read and understand Flexible Plan Investments, Ltd., ADV Part 2A and Part 3 (Form CRS) 1. Past performance does not guarantee future results. Inherent in any investment is the potential for loss as well as profit. A list of all recommendations made within the immediately preceding 12 months is available upon written request.
The original white paper, published by Flexible Plan Investments in November 2013, was written by David Varadi, David Wismer, and Jerry C. Wagner. The updated white paper, published in May 2024, was revised by Jerry C. Wagner and Daniel Poppe. flexibleplan.com
Since 1981, Flexible Plan Investments (FPI) has been dedicated to preserving and growing wealth through dynamic risk management. FPI is a turnkey asset management program (TAMP), which means advisors can access and combine FPI’s many risk-managed strategies within a single account. FPI’s fee-based separately managed accounts can provide diversified portfolios of actively managed strategies within equity, debt, and alternative asset classes on an array of different platforms. FPI also offers advisors the OnTarget Investing tool to help set realistic, custom benchmarks for clients and regularly measure progress. flexibleplan.com
RECENT POSTS


