
Editor’s Notes: Tony Dwyer, U.S. portfolio strategist for Canaccord Genuity, and his colleagues author a widely respected monthly overview of market conditions, technical factors, and future outlook called the “Strategy Picture Book.” The following provides a broad summary and excerpts from August’s market outlook, released August 25, 2016.
Our fundamental thesis points all remain constructive for the U.S. equity market. Although the market drivers may be choppy, they are all in place for intermediate-term opportunity for investors:
- The equity market is most closely correlated to the direction of earnings, which ended 2015 slightly negative due to the effects of the energy sector. We expect lower single-digit EPS growth in 2016 that is back-end loaded.
- The direction of earnings is driven by economic activity, which remains in an uptrend (albeit a modest one) due to the pronounced weakness in the commodity space and uncertainty following the “Brexit” vote.
- Positive economic activity is driven by the steepness of the yield curve and availability of money—both of which remain pro-growth.
- The steepness of the yield curve and availability of credit is driven by Fed policy, which should be extremely accommodative.
- Fed policy is driven by core inflation, which should remain historically low. This gives the Fed time to take a much more patient trajectory of rate hikes.
An illustrative chart provides further detail for each of the points above:
FIGURE 1: EARNINGS OUTLOOK—EPS LIKELY TO END 3.4% HIGHER THAN ESTIMATE
Every quarter since the Great Recession, EPS estimates have ended the earnings season higher than they began.
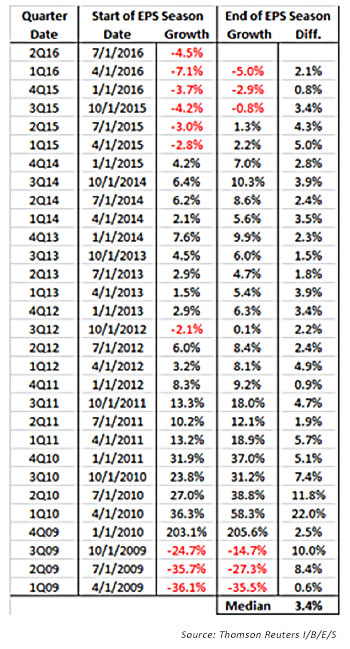
FIGURE 2: ECONOMIC GROWTH—CITIGROUP ECONOMIC SURPRISE INDEX WELL OFF LOWS
Economic expectations got too high before the release of Q2 2016 GDP, but there has been a sharp recovery in data relative to earlier year expectations.
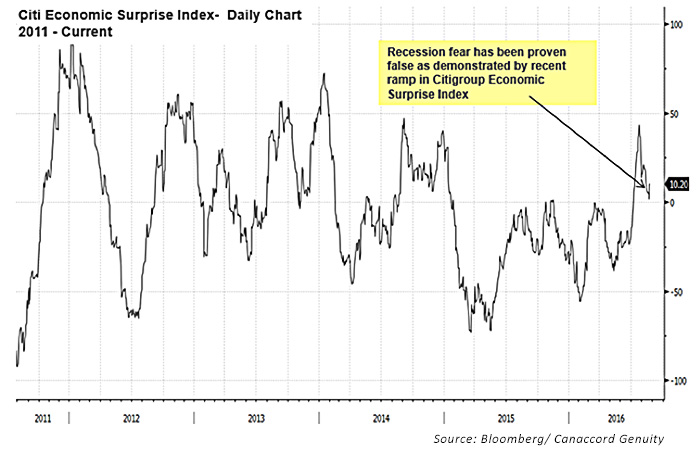
FIGURE 3: INTEREST RATES TREND—YIELD CURVE STILL STEEP & IN ‘BULL FLATTENER’
Low core inflation and real Fed funds rate, coupled with the Fed buying maturing issues, should keep the yield curve positive but flatter for a longer period. Recessions are preceded by an inversion of the yield curve by roughly 15 months.
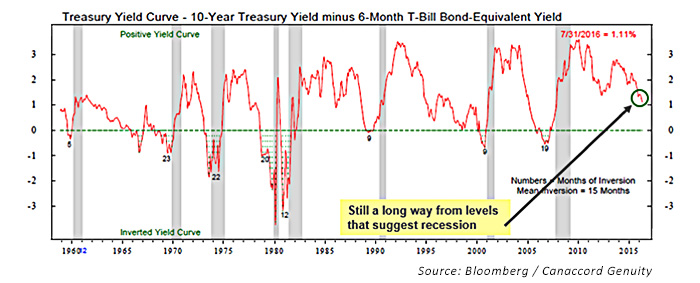
FIGURE 4: INFLATION OUTLOOK—10-YEAR BREAKEVEN SHOWING NO INFLATION FEAR
The implied 10-year inflation rate is arguing for a continued dovish Fed. This was confirmed with the recent commentary by Fed Board Chair Yellen.
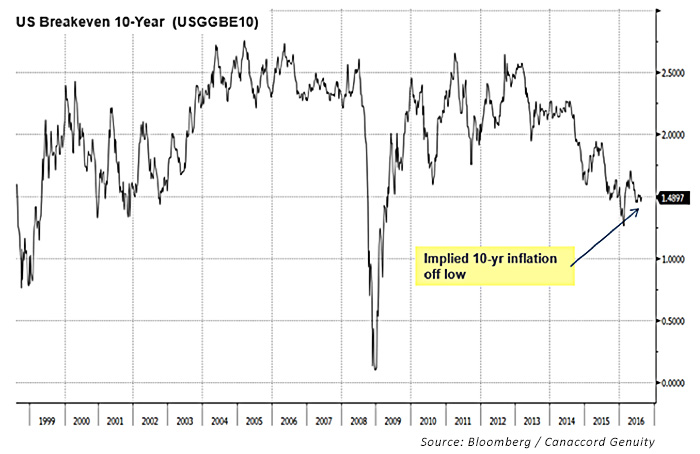
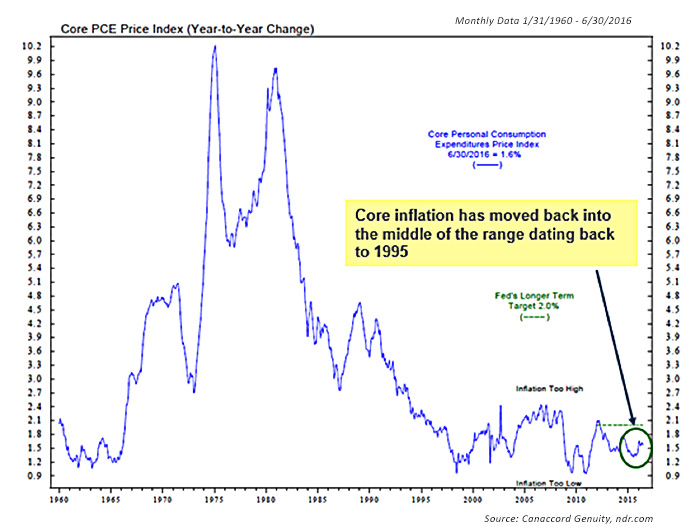
FIGURE 5: INFLATION OUTLOOK—STILL HISTORICALLY LOW AND STABLE
Core PCE remains in the middle of the 20-year range. Low inflation gives the Fed room to keep rates at current levels, but the Fed will move on further gain.
Our analysis indicates that market valuations continue to allow for a cautiously bullish market outlook and intermediate-term opportunity:
- Based on core inflation and consensus EPS expectations, valuations remain historically attractive.
- Current valuations should be seen as discounting limited economic expansion or significant reduction in earnings that seems very unlikely given credit and fundamental backdrop.
- Ultimately, we believe the bull market won’t end until the combination of market multiple and inflation reach above 22. The current reading is roughly 19 (17 PE + 2% inflation).
- At the current levels, the S&P 500 is trading at only 18.5x the 2016 consensus of $117.97 EPS and 18.0x our estimate of $121 EPS.
- Our 2016 target of 2,175 assumes 18x on $121/share in EPS.
- Our 2017 target of 2,340 assumes 18x on $130/share in EPS.
 Tony Dwyer is the head of the U.S. Macro Group and chief market strategist at Canaccord Genuity. He also sits on the firm’s U.S. operating committee. Mr. Dwyer joined Canaccord Genuity in 2012 and is known for the practical application of macroeconomic and tactical market indicators. Mr. Dwyer was previously equity strategist and director of research at Collins Stewart and a member of the firm's executive committee. Mr. Dwyer is a frequent guest on many financial news networks. canaccordgenuity.com
