

One of the tools Lowry Research employs to meet this end is “90% Days.” 90% Days occur when at least 90% of a stock exchange’s volume and the points of the stocks listed on that specific exchange are either to the upside (an “Upside Day”) or downside (a “Downside Day”). For example, a “90% Upside Day” is registered when points gained equal 90% or more of the sum of points gained plus points lost (excludes unchanged), and where upside volume equals 90% or more of the sum of upside plus downside volume.
We use points and volume together to provide a means of further confirmation and also to avoid being misled by idiosyncrasies often present in volume data—for example, abnormally high volume observed in low-priced stocks during a company acquisition. Since it was first demonstrated by Lowry in 1975, the method became recognized for being able to accurately identify the panic days found near major, and most minor, market bottoms.
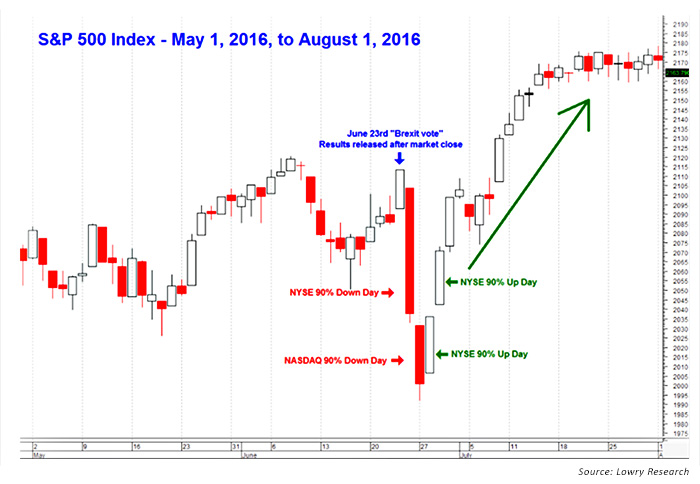
A recent case study from which Lowry clients could profit was the “Brexit low” on June 27. This low was associated with the sharp sell-off following Britain’s unexpected vote to leave the European Union. First, in the process of exhausting sellers or creating a “selling climax,” we observed a 90% Downside Day on the NYSE on June 24 and another the following trading session (June 27) for the NASDAQ. (See Figure 1.) We note the NASDAQ Downside Day not because it is necessary for confirmation, but because it provided greater conviction of the intense selling environment. But, since a bottom in prices cannot be formed by exhausted supply alone, there next needs to be evidence of a resurgence of demand that could sustain a renewed rally. So ideally, usually within a few days, the 90% Downside Day should be followed by one or more days of very intense buying (a 90% Upside Day). For the NYSE, back-to-back 90% Upside Days were recorded on June 28 and June 29. This served as a realization by investors that prices had been driven low enough to again attract buyers to the stock market.
FIGURE 1: IDENTIFYING A MARKET BOTTOM POST-BREXIT
Though the signal occurred with the overall market within 3.6% of all-time highs, consecutive 90% Upside Days are a relatively rare development and have usually been registered near the beginning of important intermediate- and longer-term-trend rallies. The combination of a 90% Downside Day followed by two 90% Upside Days, all on high volume, combined with a buy signal from one of Lowry’s proprietary short-term indicators (June 29), allowed for a high-conviction call to action in anticipation of an intermediate-term rally to new recovery highs.
Since Lowry introduced it, this systematic approach to 90% Days has proven repeatedly to be a very valuable tool in identifying the extremes of human psychology that occur near major market bottoms. Obviously, no prudent investment program should be based solely on a single indicator. Other measurements of price, volume, breadth, and momentum are needed to monitor the strength of buying versus selling on a continuous daily basis. But, we believe the 90% indicator, as outlined above, will be an enduring, important part of stock market analysis. Like the other facets of the Lowry Analysis, it is derived directly from the “law of supply and demand”—the foundation of all economic analysis.
 Vincent Randazzo, CMT, is a senior market analyst at Lowry Research with more than 15 years of experience in professional equity market research, technical analysis, and market intelligence. Before joining Lowry, Mr. Randazzo was chief market analyst at NASDAQ. He was also director of research at ICAP and a research salesperson at Morgan Stanley and UBS. He has been a Chartered Market Technician (CMT) since 2008. For more information on Lowry Research, please visit lowryresearch.com.
 Christopher Diodato, CMT, is a market analyst with Lowry Research, where he uses Lowry’s proprietary research methods and presents actionable findings to clients. Before joining Lowry Research, Mr. Diodato was a financial advisor with Morgan Stanley and a member of the portfolio management team at Cetera Retirement Services. In addition to holding the Chartered Market Technician (CMT) designation, he is a Level III candidate for the Chartered Financial Analyst (CFA) program. https://www.lowryresearch.com
Lowry Research Corporation was founded in 1938 to provide analysts and investment professionals with an unbiased, factual analysis of the stock market. Its work is based on daily price change/volume statistics of all stocks traded on the New York Stock Exchange and NASDAQ Stock Market. This provides the statistical foundation for a supply-versus-demand analysis of market trends. For more information on Lowry Research, please visit lowryresearch.com.