

“Don’t confuse the issue with facts” is one of my favorite sayings when it comes to the markets. I even bought the domains dontconfusetheissuewithfacts.com and donotconfusetheissuewithfacts.com. For example, Brexit might not be good for the markets in the long term; however, the S&P 500 has so far not only erased the entire Brexit slide, but has since rallied to all-time highs.
Many sectors within the S&P 500 have now also recently broken out to new highs. A nonexhaustive list includes Health Services, Software, Retail, Internet, and Foods. Quite a few other areas like Materials & Construction, Semis, Durables, and Non-Durables have been rallying lately and are now closing in on all-time highs.
The Drugs sector, which has been stuck in a sideways intermediate-term range, is now breaking out to new multi-month highs.
Major long-term bottoms appear to be in place in Metals & Mining and Energy stocks.
The point is, overall, things continue to improve, and opportunities are being presented to trend followers in a number of areas.
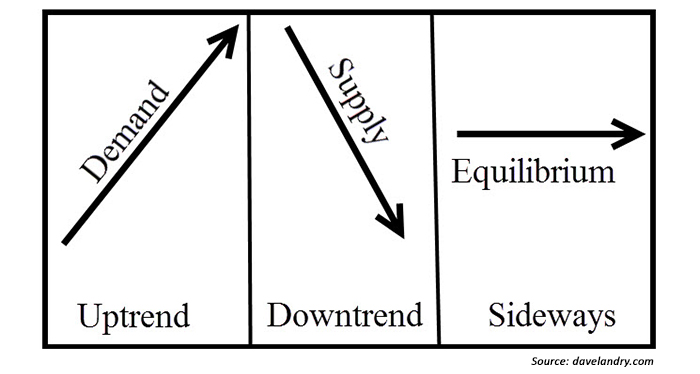
Yet, there’s always something to worry about when it comes to trend following. Has the market gone too far too fast? Probably. Just like it is hard to run another race right after you have completed a marathon, it’s hard for a market to mount a new leg on top of an old one. Again though, what is, is. Don’t argue with new highs. However, my concern is that if the correction comes sooner rather than later, the S&P 500 could easily pull all the way back to prior breakout levels around 2120. If that occurs, the up arrow would then turn back to sideways at best.
Bonds are at nosebleed levels. True, as a trend follower, a market that is at high levels can always go higher, but how much further can rates go? Zero? (Yes, I know they could technically go negative but that’s a “whole ‘nother problem.”) One has to wonder how long the “where else are you going to put your money?” argument for stocks will last when—not if—bonds finally begin to crack.
Although more and more sectors appear to be joining the party, I’d sure like to see broader-based indexes such as the Russell 2000 make new highs. It remains overbought and right at overhead supply. This is not a good place to look to buy a market. To a somewhat lesser extent, the same holds true for the NASDAQ broad index.
True, the Brexit recovery shows that this market is resilient, but the Brexit-related sell-off shows just how vulnerable this market can be. That the market has generally bounced back from dips since 2009 continues to reassure the buy-and-hope (oops, I mean hold) crowd that the market “always goes up in the long term.” As long as the market continues to bounce back, everyone remains calm and happy. However, the Brexit slide shows how fast things can change. Those who are last in tend to be the first out. The Johnny-come-latelies are quick to bail as soon as things begin to sour. The problem is that sometimes selling can beget more selling, as more and more “investors” go underwater.
In a previous How I See It article, I pointed out that there was a major weekly “Bowtie” sell signal in the S&P 500 from last summer. Since the market has recently been probing new highs, that signal has been negated. It’s been said that the early bird gets the worm, but the second mouse gets the cheese. Sometimes the real signal comes shortly after a false alarm. If you look at major tops and bottoms throughout history, sometimes they are much more of a process than an event—even though it might not feel like it at the time. In stocks, the 2002–3 bottom and subsequent top in 2007–8 comes to mind. Other notable examples include tops in the EUR/USD currency pair in 2008 and in bonds and gold in 2012–13.
 Dave Landry has been trading the markets since the early 1990s and is the author of three books on trading. He founded Sentive Trading LLC in 1995 and since then has been providing ongoing consulting and education on market technicals. He is a member of the American Association of Professional Technical Analysts and was a registered Commodity Trading Advisor (CTA) from 1995 to 2009. davelandry.com