


A pure technical analyst largely disregards fundamentals, relying solely on charts that reflect all known information about an instrument. Though we at the Option Queen Letter are technical analysts—ardent students of price action and volume—we recognize the importance of fundamentals.
Early sailors employed both celestial navigation and crude maps marking land formations to navigate more accurately. Similarly, we use our understanding of market timing via technical analysis, together with a sound understanding of fundamental analysis, to more accurately pick and manage our positions.
What fundamentals are generally important in analyzing company stocks? Here are a few key things that we tend to look for:
- Sound companies with a strong business case, offering products or services with future growth prospects in an ever-changing environment.
- Strong and consistent production of free cash flow and (when applicable) declining debt leverage.
- Strong insider ownership.
- Solid dividends, if we can get them.
These parameters are great starting points; from here, there are many company stocks that can be looked at as potential buys.
With commodities, U.S. dollar strength/weakness, weather issues, geopolitics, and the supply/demand dynamic are some of the fundamental parameters that you should look at. We believe, however, that technical analysis is far more effective for the analysis of commodities than fundamental analysis.
When analyzing commodities, you should be looking for charts with long-, medium-, and short-term uptrend patterns. Remember, an uptrend shows higher highs and higher lows. If you are looking for shorts, you are looking for lower highs and lower lows across all time frames. We would also like to see higher volume on up days and lower volume on down days if you are looking for long positions. (Please see our article “Using basic technical analysis to confirm market trends.”)
Several recent charts of West Texas Intermediate (WTI) crude oil help demonstrate why it is important to examine various time frames in technical analysis. These charts were all constructed and analyzed on June 28, 2018.
Figure 1 is a daily chart of West Texas crude (WTC). Of note, narrowing Bollinger Bands (in red) indicated a potential violent price move in the near future, which occurred this past week when WTC broke above resistance at the $66.20 area. Indeed, WTI had a powerful move to the upside in the next several trading days, easily breaking through resistance and surpassing previous recent highs around $72.
FIGURE 1: DAILY CHART OF WEST TEXAS INTERMEDIATE CRUDE (WTI)
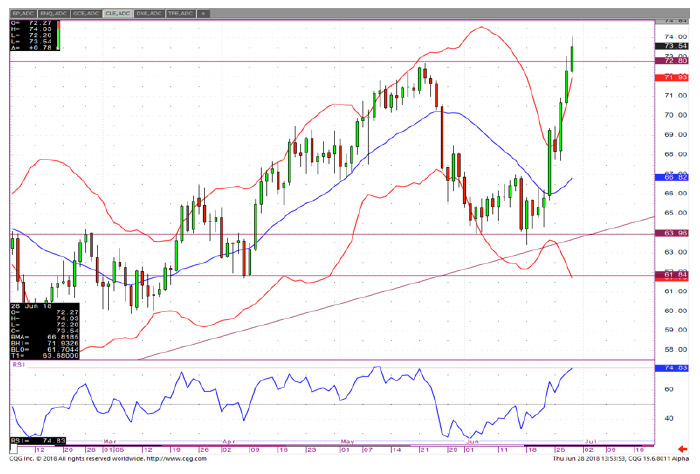
Source: optnqueen.com, CQG charting
Figure 2 is a weekly continuation chart of WTI. Notice that the uptrend line begins the week of Aug. 28, 2017, and continues through recent weeks.
FIGURE 2: WEEKLY CHART OF WEST TEXAS INTERMEDIATE CRUDE (WTI)
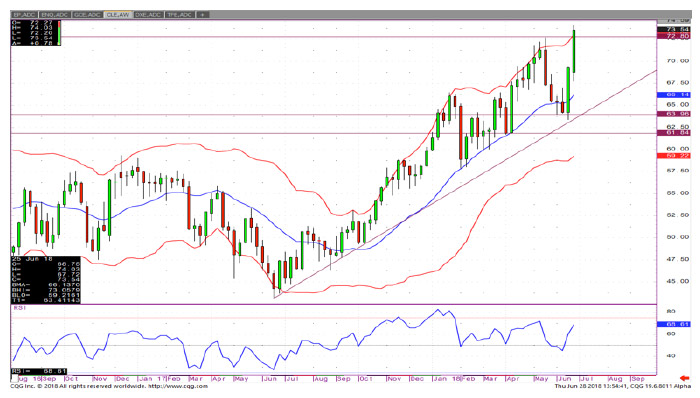
Source: Source: optnqueen.com, CQG charting
Figure 3 is a monthly chart of WTI showing a long base, which lends credence to prospects for the continuation of an uptrend.
FIGURE 3: MONTHLY CHART OF WEST TEXAS INTERMEDIATE CRUDE (WTI)
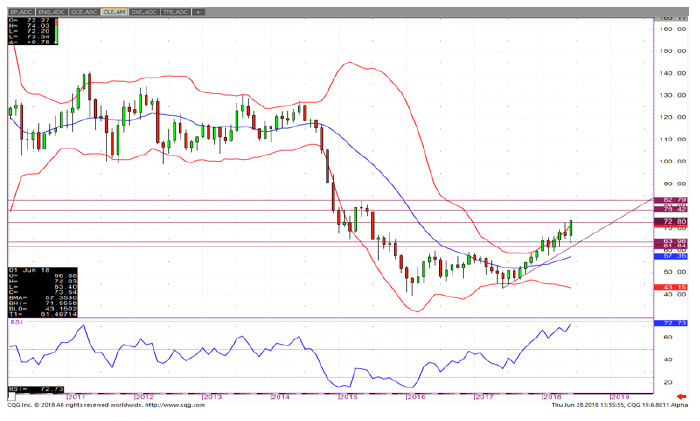
Source: optnqueen.com, CQG charting
Figure 4 is a quarterly chart of WTI, showing where the price has evolved from a long-term view of this product. Among other factors, one can see the historical potential for significantly higher prices.
FIGURE 4: QUARTERLY CHART OF WEST TEXAS INTERMEDIATE CRUDE (WTI)
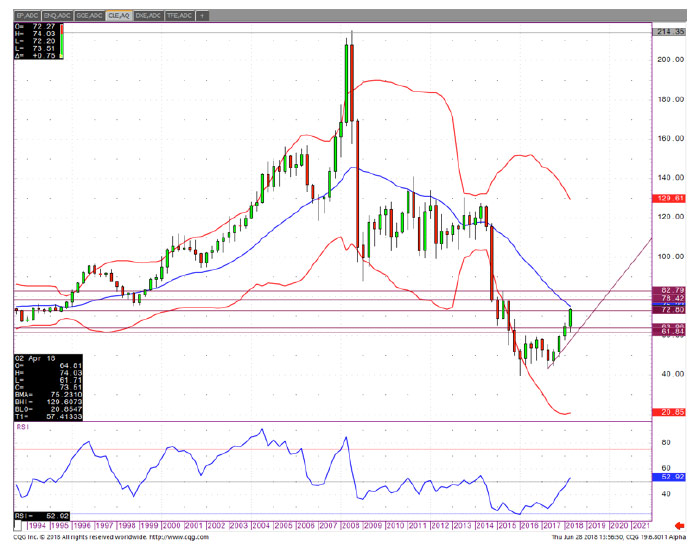
Source: optnqueen.com, CQG charting
By looking across time frames, what have we learned? The quarterly chart tells us that crude oil is rallying within a long-term downtrend. The horizontal and uptrend lines on the monthly chart show where support for the product lies, with significant resistance at $78.42 and $82.79.
The weekly chart highlights $62.07 as a support zone in what had been an oversold market, ripe for a swing to the upside. The daily chart shows a sideways moving market that had a breakout, attempting to resume the uptrend. With the Relative Strength Indicator (RSI) on the daily now elevated (as of 6/28) and price outside the Bollinger Bands, a pullback would not surprise here.
None of the above levels were difficult to find using simple trend/horizontal lines. The RSI on the bottom of each chart provides more information. The RSI measures the speed and change of price movements, moving between the extremes of zero and 100. Traditionally, RSI is considered overbought when above 70 and oversold when below 30. We do not necessarily rely on indicators, as they can often mislead you. Rather, we use them to distill a better understanding of market mood and condition. Remember, in an extreme downtrend, indicators can remain oversold for long periods of time (bearishly oversold) and overbought for long periods of time (bullishly overbought).
The important takeaways? Fundamental analysis can prove extremely valuable for analysis of individual stocks when used in combination with technical analysis. However, we find that pure technical analysis over several different time frames is more valuable when trying to assess trends for commodities such as crude oil.
The opinions expressed in this article are those of the author and do not necessarily represent the views of Proactive Advisor Magazine. These opinions are presented for educational purposes only.
 Jeanette Schwarz Young, CFP, CMT, CFTe, is the author of the Option Queen Letter, a weekly newsletter issued and published every Sunday, and "The Options Doctor," published by John Wiley & Son in 2007. She was the first director of the CMT program for the CMT Association (formerly Market Technicians Association) and is currently a board member and the vice president of the Americas for the International Federation of Technical Analysts (IFTA). www.optnqueen.com
Recent Posts: