

I look for both cheap and expensive price areas. If I believe a level discovered by trend lines or horizontal lines is expensive, I will sell calls. (A “call” is an option that gives the option buyer the right to purchase the issue at a specified price at a certain date in the future.) If I like the issue and want to own it, I will sell naked puts hoping that it will be put to me. (A “put” is an option that gives the option buyer the right to sell the issue at a specified price at a certain date in the future.) In the meantime, I collect the premiums and wait.
There are times when I believe I need to be hedged. As a put seller, I am agreeing to buy the issue at a price by a stated time in the future. For that obligation, I am paid a premium for taking that risk. To further hedge the position, I will buy a put at a lower strike price than the put that I sold, limiting the amount of loss on the trade if the trade goes bad.
Whether or not a hedge position is included typically depends on my level of comfort with the underlying issue. I may also sell a covered call or buy a call above the call sold, just in case the stock runs further than I thought it would. Selling a call obligates me to sell the underlying issue at a given price at a certain time in the future. For this, I am paid for preselling the issue. Buying a call at a higher strike price than the one I sold allows me to continue to profit from the trade should the stock continue moving to the upside. These hedges are not free and do erode some of the premium revenue generated by selling options.
My favorite techniques are to sell naked puts and to establish hedged positions. As a former market maker, I love to put money in my pocket, so I look for trades that might help me achieve that goal. I will use Mylan Laboratories (MYL) as an example of a hedged trade. I selected Mylan Laboratories because it is a good example of how viewing charts in different time frames can provide different technical perspectives.
Figure 1, a daily chart for MYL, clearly shows the stock in a current uptrend, making it a reasonably good candidate for selling puts and collecting the premium.
FIGURE 1: DAILY CHART OF MYLAN LABORATORIES (MYL)
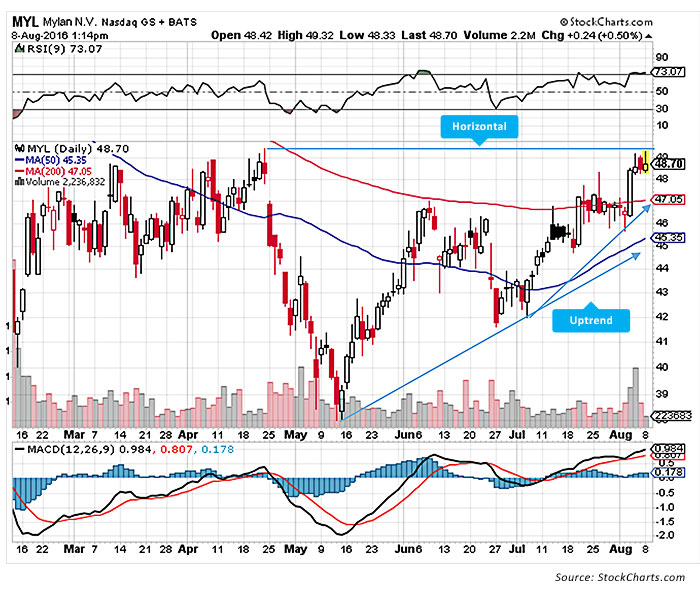
Note that this daily chart for MYL stops around the $50 level. Note also that there is support at $42 and $41.50, with the next support around $38.
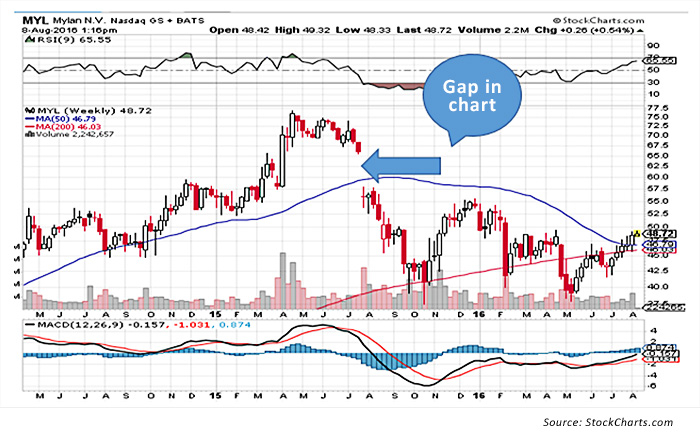
Figure 2, a monthly chart for MYL, shows two very different broad conclusions:
- The stock has an overhead gap to fill and is currently well off historically higher levels, providing some optimism about its prospects.
- The stock is entering an area of some resistance and has a recent history of sharp down moves from this general area, introducing a note of caution.
FIGURE 2: MONTHLY CHART OF MYLAN LABORATORIES (MYL)
MYL is a prime candidate, then, for a hedged trade.
Here is a specific construct for a hedged trade on MYL, using both put spreads and call spreads.
Put spread
- Sell the MYL Jan 2017 40 put for 1.38 ($138).
- Buy MYL Jan 2017 35 put for 0.65 ($65).
Collect 0.73 ($73) with a downside risk of $500.
Call spread
- Buy 100 shares of MYL at $48.86 ($4,886)
- Sell the January 50 call for 3.80 ($380)
- Buy the January 55 call for 1.95 ($195)
Collect 1.85 ($185) and still have skin in the trade just in case the market blows to the upside.
Combining both legs of the trade, you collect 1.85 for the call spread and 0.73 for the put spread, putting 2.58 ($258) in your pocket in a relatively well-hedged position. The downside risk of the trade can be further controlled with a stop loss in the event MYL trades much lower. The upside potential is theoretically unlimited if the stock soars to the upside. If the stock stays in a tight range and moves little, you can collect the option premium on both sides and perhaps try the same trade again next month on the stock you still own.
Why did I choose the levels designated for the option strike prices? If you go to the chart, you can easily see that $50 was last achieved on February 28, 2016, and the stock did have some difficulty at that level. A price over $55, a level last seen on July 27, 2015, if attained, would close the gap on the chart and open the door to much higher levels.
Technical analysis gives you the ability to see the markets from the point of view of supply and demand. Options give you the ability to creatively think and put your strategy into action. If you choose to use naked puts, you can actually make money on a stock you want to own without ever owning it. Yes, sometimes I wish I had bought the stock, but the income is good and the risk is that I will own a stock I really want to buy at a lower price level. If I am wrong, I can always sell the stock or sell a deep in-the-money call on the stock.
 Jeanette Schwarz Young, CFP, CMT, CFTe, is the author of the Option Queen Letter, a weekly newsletter issued and published every Sunday, and "The Options Doctor," published by John Wiley & Son in 2007. She was the first director of the CMT program for the CMT Association (formerly Market Technicians Association) and is currently a board member and the vice president of the Americas for the International Federation of Technical Analysts (IFTA). www.optnqueen.com