What new presidents historically mean for markets
What new presidents historically mean for markets

My longtime readers know that I do a lot of research on the presidential cycle pattern (PCP), which is based on the premise that the stock market shows notable similarities at comparable points in prior presidential terms. The PCP is calculated by averaging the price history of the S&P 500 in four-year increments.
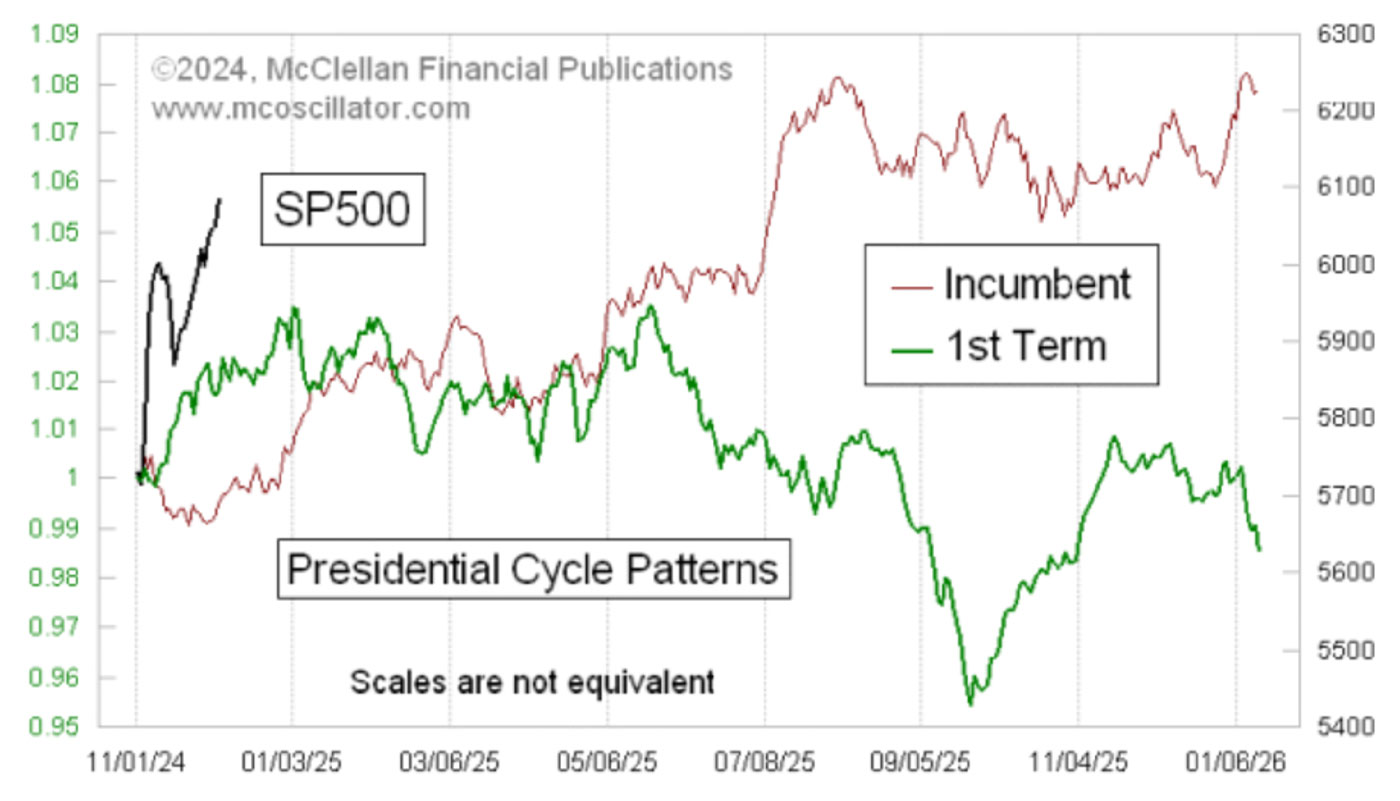
One can create different permutations for the PCP, such as comparing Republican to Democratic presidents (which is not very useful) and first-term presidents to incumbents. Figure 1 illustrates the latter variation. As you can see, there has been a big difference between electing a new president from a different party and reelecting an incumbent.
FIGURE 1: HISTORICAL CYCLE PATTERNS FOR INCUMBENT AND
FIRST-TERM PRESIDENTS
Source: McClellan Financial Publications
In Figure 1, the green line represents the average performance during a new president’s term. Yes, I know that President-elect Trump will begin his second term in January 2025, but for this analysis, he is considered a first-term president.
The rationale for this classification stems from my 30 years of research, during which I have observed a recurring theme: A new president typically spends the first two years “discovering” that things are even worse than anticipated during the campaign. Weekly revelations of crises left by the prior administration often culminate in claims that the “only solution” to these problems is whatever package of taxes, tax cuts, spending, or reforms the new president wants Congress to pass.
This is important because investors tend to get bummed out by hearing that things are worse than we all thought. And that makes people incrementally less interested in investing.
When an incumbent president (or incumbent party candidate, as in George H. W. Bush) wins, little time is spent blaming the predecessor for everything—for obvious reasons. And generally speaking, the stock market tends to do well in the first year of an incumbent’s second term, partly because the stock market and the economy had to be doing well going into the election for the incumbent to win. So, the previous chart shows a big difference between the PCPs for first-term and second-term presidents, especially during the first year.
![]() Related Article: Two very different outlooks for the S&P 500—Could both be right?
Related Article: Two very different outlooks for the S&P 500—Could both be right?
We also see a difference in the period right after the election. When a candidate from a new party wins, Wall Street often celebrates because of the sentiment, “Hooray! Change!” But that enthusiasm tends to fade by inauguration day when people realize the new president has been in office for a whole day and has not fixed everything yet. This is also the time that wrangling with Congress starts in earnest, leading to doubts about how the fights will turn out. Wall Street hates unknowns.
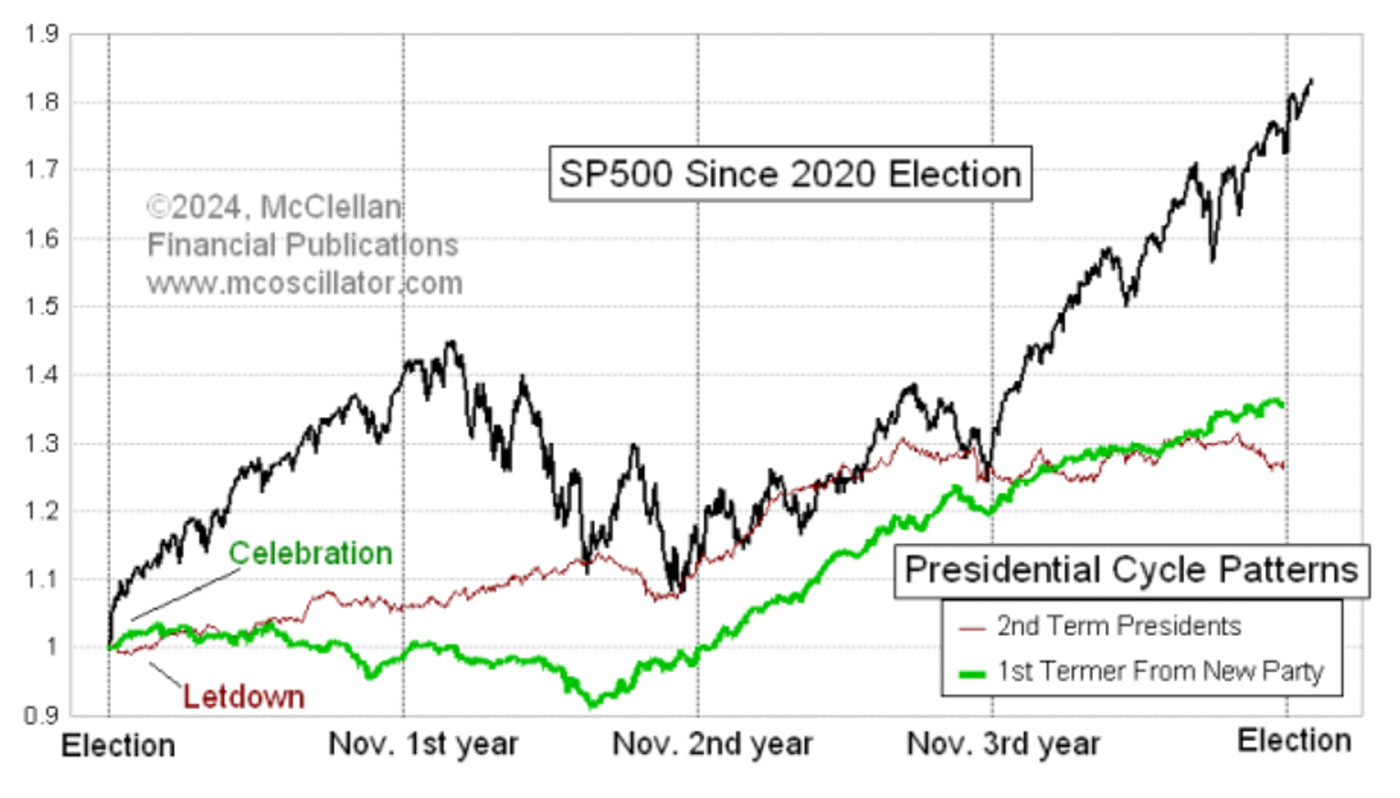
Back in 2020, things played out a bit differently. The stock market cruised higher during President Biden’s first year in office. However, it is worth noting that at the time of the election, the Federal Reserve was pumping $1 trillion per month into the banking system as part of the fourth round of quantitative easing (QE4). This stimulus continued until early 2022 when the Fed reversed course and began quantitative tightening (QT). That rather abrupt policy change wiped out almost all of 2021’s gains.
FIGURE 2: S&P 500 PERFORMANCE VS. PRESIDENTIAL CYCLE PATTERNS
2020 ELECTION TO 2024 ELECTION
Source: McClellan Financial Publications
Figure 2 highlights that by the third year of a presidential term, the big differences between first-term and second-term presidents largely disappear, and the market almost universally trends higher in the third year of a presidential term. Exceptions include 1931 during the Great Depression and 1939 when the Wehrmacht was marching through Poland. Outside of conditions like that, third years are nearly always positive for the market.
And by the time the next election year arrives, the early differences in market performance between first-term and second-term presidents tend to even out. Thus, any market difficulties in 2025 will likely be forgotten by 2028.
The big bullish expectation about Trump’s upcoming inauguration is that he is going to usher in a great new era of governmental efficiency, low taxes, lower spending, and deregulation—which will cause the economy to do amazing things. But if Mr. Trump really is successful at curtailing government deficits and getting us to a balanced budget, that is historically a bearish factor for the stock market, as I discussed in October. And if any presumption about the market’s future gets everyone leaning too far one way, well, we know what can happen then.
In other words, enjoy the party until inauguration day, and then get ready to put on your trading shoes.
The opinions expressed in this article are those of the author and the sources cited and do not necessarily represent the views of Proactive Advisor Magazine. This material is presented for educational purposes only.
This is an edited version of an article that first appeared at McClellan Financial Publications on Dec. 5, 2024.
 Tom McClellan is the editor of The McClellan Market Report newsletter and its companion, Daily Edition. He started that publication in 1995 with his father Sherman McClellan, the co-creator of the McClellan Oscillator, and Tom still has the privilege of working with his father. Tom is a 1982 graduate of West Point, and served 11 years as an Army helicopter pilot before moving to his current career. Tom was named by Timer Digest as the #1 Long-Term Stock Market Timer for both 2011 and 2012. mcoscillator.com
RECENT POSTS


