
What is the optimal portfolio allocation to gold?
What is the optimal portfolio allocation to gold?

The role of gold in investment portfolios: Part II
Updated analysis supports an optimal portfolio allocation to gold of 20%.
Editor’s note: A revised and updated version of this article can be found here.
Flexible Plan Investments, an active money manager and provider of risk-managed investment services, first authored an extensive analysis of the role of gold in investment portfolios in 2013. This white paper has been recently updated and is being presented as a guest commentary in two parts in Proactive Advisor Magazine. Last week’s Part I examined broad issues related to how investing in gold performed in specific market environments.
We are pleased to present Part II here, which looks more closely at gold’s performance in classic market regimes and offers broad conclusions on optimal gold allocations for investment portfolios. This analysis suggests an optimal gold allocation of 20%, which produced higher risk-adjusted returns than any other portfolio alternative.
A popular concept in modern portfolio theory is the “All Weather” approach to economic regime investing, with four different “states of the world” characterized by either rising or falling inflation and/or rising or falling economic growth. Bridgewater Associates, a large and very successful hedge fund, has developed a simple conceptual graph to capture this idea (Figure 9):
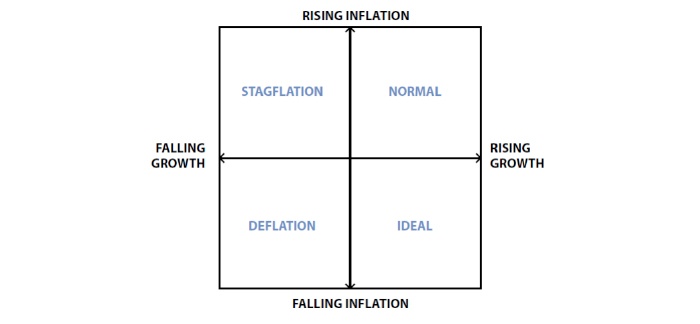
Source: Adaptation of All Weather chart by Bridgewater Associates
- “Normal”: Real economic growth rate (GDP) is rising and inflation (CPI) is rising.
- “Ideal”: Real economic growth rate (GDP) is rising and inflation (CPI) is falling.
- “Stagflation”: Real economic growth rate (GDP) is falling and inflation (CPI) is rising.
- “Deflation”: Real economic growth rate (GDP) is falling and inflation (CPI) is falling.
The role of gold in
investment portfolios
by Flexible Plan Investments explores
why investors should reconsider
their portfolio’s allocation to gold.
Source: Flexible Plan Investments
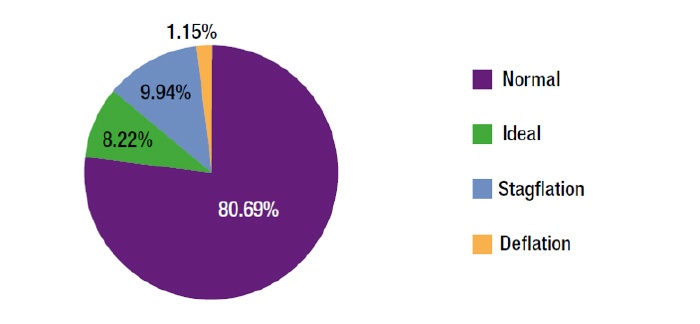
“Stagflation” is a situation where inflation is rising and growth is falling. This has occurred roughly 10% of the time. The most notable example of stagflation was during the 1970s when inflation was high, partially due to the energy crisis, and the economy endured some difficult times.
Finally, “Ideal” conditions are defined as the period where inflation is falling but economic growth is robust and rising. This regime was present roughly 8% of the time. This is a great environment for business expansion and for investors in many asset classes. The best example in recent U.S. history of an “Ideal” period is the 1990s. Ideal conditions also occurred as recently as 2016–2017.
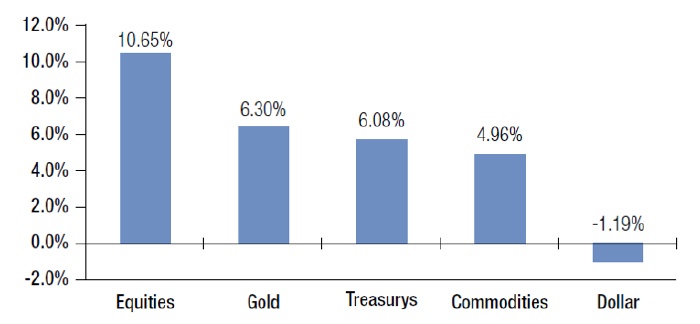
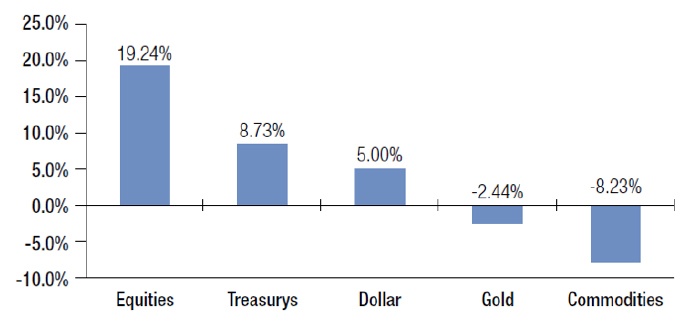
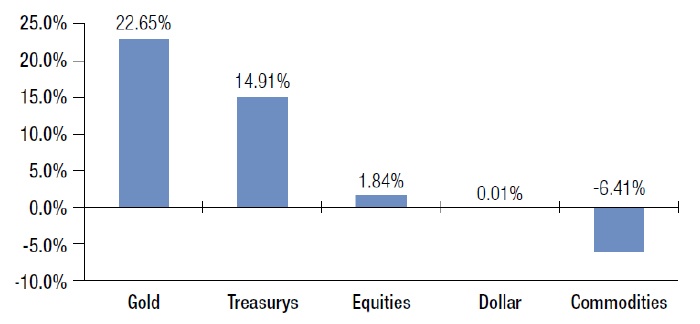
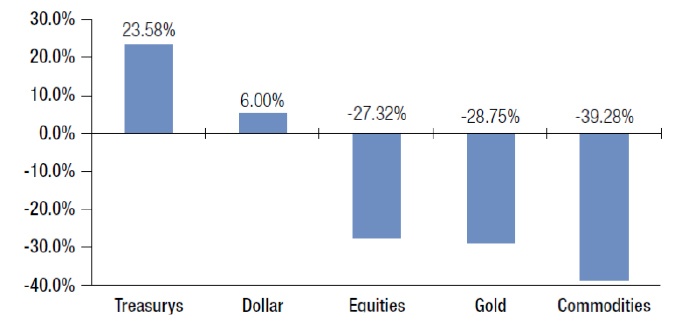
Figures 11 through 14 summarize the performance of our previously referenced asset classes during each of these economic regimes.
Source: Flexible Plan Investments
Source: Flexible Plan Investments
Source: Flexible Plan Investments
Source: Flexible Plan Investments
- In the most commonly occurring circumstance of “Normal” economic conditions, gold finished second to equities in terms of average annual return.
- In “Ideal” conditions, equities provided the best performance.
- In times of “Stagflation,” gold provided vastly superior returns to any other asset class.
- “Stagflation” tends to happen slightly more frequently than “Ideal” economic conditions (10% vs. 8%). Gold underperformed equities significantly during “Ideal” conditions. Yet, during periods of “Stagflation,” gold’s 23% annualized gain versus the gain for equities of 2% is certainly a compelling statistic.
- Deflation was the worst of times for gold, although it did surpass the general commodity asset class.
This, once again, reinforces the case for gold as an important portfolio diversifier. Gold provided positive returns under most market conditions (91% of the time in the last 45 years gold was either number one or number two in performance). Gold may not outperform equities in times of normalcy and growth, but it has greatly outperformed equities in times of market stress and inflation scenarios. Because such times have had among the greatest negative returns for traditional equity portfolios, gold can have a significant effect on long-term portfolio volatility.
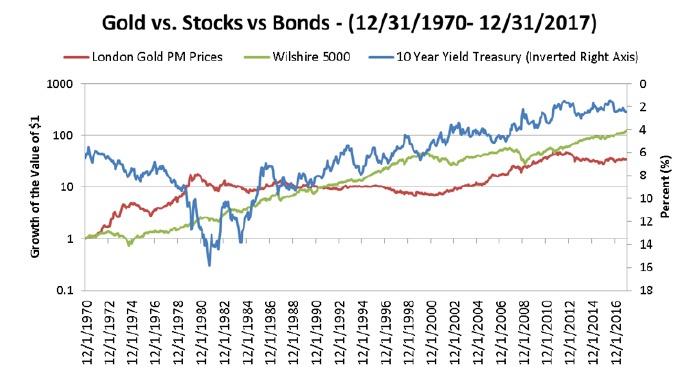
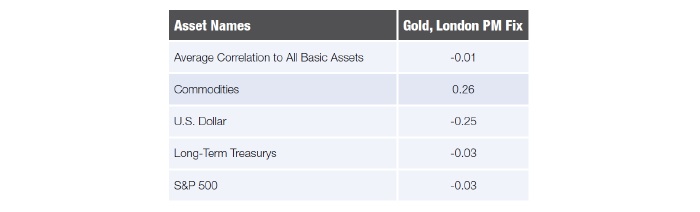
As Figure 15 illustrates, gold provided a low correlation to both stocks and bonds and did not move in tandem with traditional asset classes.
Source: Flexible Plan Investments
Source: Flexible Plan Investments
In a 2006 study, Richard Michaud, Robert Michaud, and Katharine Pulvermacher of New Frontier Advisors demonstrated that gold was part of the optimal portfolio for investors at all levels of risk-preference tolerances—not just for a balanced investor. Adjusting for uncertainty and seeking the most robust solution, they found that for risk-level tolerances consistent with a balanced investor (risk of around 10% standard deviation), the optimal allocation to gold was found to be above 10% in the base-case scenario using multiple asset classes and historical market data.
Figure 16 is from the Michaud et al. study. It shows the optimal portfolio weight in gold and the maximum (upper) and minimum (lower) allocations at different levels of target portfolio risk.
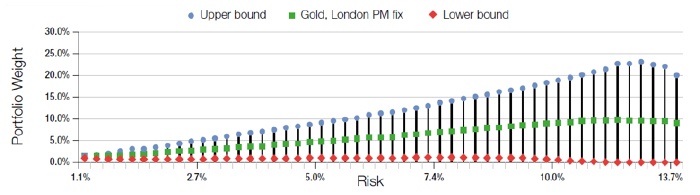
Source: Michaud et al., 2006.
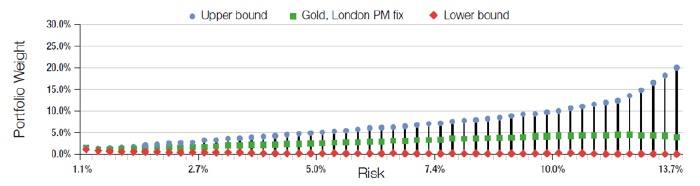
Source: Michaud et al., 2006.
First, we define typical: The most common portfolio is one that contains a 60% allocation to equities and a 40% allocation to bonds, or what the literature might refer to as a traditional “balanced portfolio.”
As a test of gold’s possible diversifying power, we can use this typical portfolio and add a varying percentage allocation to gold to determine whether we can increase risk-adjusted returns. We will represent stocks in the portfolio with the Vanguard Total Stock Market Index, and for bonds, we will use the 10-year Treasury Total Return Index.
Figure 18 shows the risk-adjusted return ratio (Sharpe) as a function of the allocation to gold from 1973 to the present. A balanced portfolio has a Sharpe ratio of 0.9038 during the period.
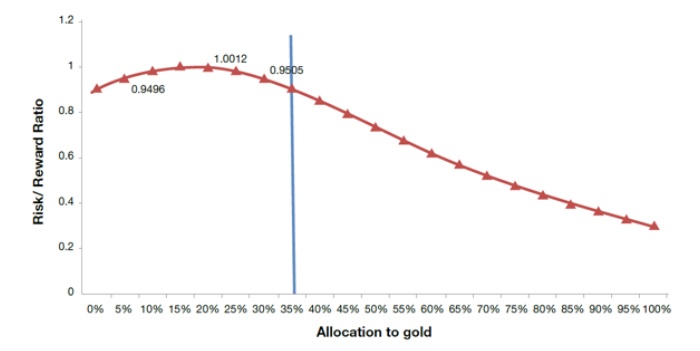
Source: Flexible Plan Investments
As Table 2 demonstrates, it has been possible to allocate as much as 35% to gold in a portfolio and still have a superior risk-reward ratio to a portfolio that holds only a balanced fund. This also shows that the optimal allocation from a risk-reward standpoint has been to allocate 20% to gold and 80% to a balanced portfolio.
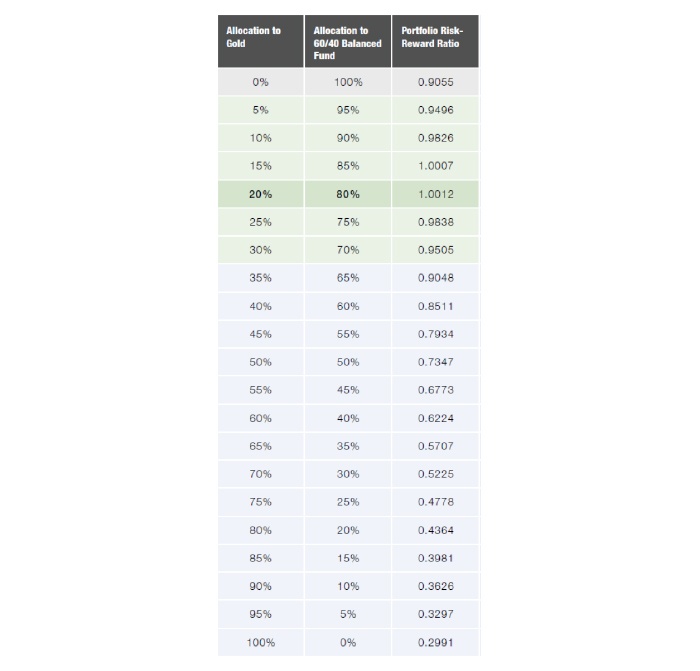
Source: Flexible Plan Investments

Source: Flexible Plan Investments
This article presents an excerpt of the white paper “The Role of Gold in Investment Portfolios.” The complete paper—including a list of source data—can be found here.
Past performance does not guarantee future results. Inherent in any investment is the potential for loss as well as profit. A list of all recommendations made within the immediately preceding 12 months is available upon written request.
This white paper is provided for information purposes only and should not be used or construed as an indicator of future performance, an offer to sell, a solicitation of an offer to buy, or a recommendation for any security. Flexible Plan Investments, Ltd., cannot guarantee the suitability or potential value of any particular investment. Information and data set forth herein have been obtained from sources believed to be reliable, but that cannot be guaranteed. Before investing, please read and understand Flexible Plan Investments, Ltd., ADV Part 2A and Part 2A Appendix 1.
The original white paper, published by Flexible Plan Investments November 2013, was written by David Varadi, David Wismer, and Jerry C. Wagner. This updated white paper, published in June 2018, was revised by Jerry C. Wagner, Jason Teed, and Tim Hanna. flexibleplan.com
Since 1981, Flexible Plan Investments (FPI) has been dedicated to preserving and growing wealth through dynamic risk management. FPI is a turnkey asset management program (TAMP), which means advisors can access and combine FPI’s many risk-managed strategies within a single account. FPI’s fee-based separately managed accounts can provide diversified portfolios of actively managed strategies within equity, debt, and alternative asset classes on an array of different platforms. FPI also offers advisors the OnTarget Investing tool to help set realistic, custom benchmarks for clients and regularly measure progress. flexibleplan.com