There is no shortage of skeptics eyeing the recent turbocharged advance of U.S. equities from post-Brexit lows. The S&P 500 has posted a rally of 8.3% since late June (as of July 19), and 90% of large-cap stocks are now trading above their 50-day moving averages.
Those market observers who are not convinced the rally has legs, or a basis in fundamentals, cite many factors. The major arguments can be summed up in six main points:
- The recent rally was initially fueled by short covering and continues to benefit significantly from corporate share buybacks. (A June report from FactSet, for example, showed corporate buybacks in Q1 2016 grew by 15.1% versus 2015.)
- Low fixed-income returns leave large institutional investors no real alternative to relatively heavy equity allocations.
- Global central bank rate policy looks to remain artificially supportive of inflated asset prices for the foreseeable future.
- Relative weakness in corporate earnings, business investment, and M&A activity is indicative of an aging bull market, leading to valuations that are not merited by underlying growth factors.
- All-time highs for the S&P 500 have not been “confirmed” by the NASDAQ Composite, the Russell 2000, or the Dow Transports, according to last weekend’s “The Trader” column in Barron’s.
- Uncertainty around the U.S. elections and geopolitical turmoil in many areas around the globe create a higher-risk investment environment.
One major argument countering all of this negativity is the rebound in several key U.S. economic indicators. After months of economic data that was neutral at best, some “green shoots” are finally beginning to appear. This provides a quick look at some of the major factors suggesting some improvement in the overall economic picture:
Job growth—After May’s dismal labor report showing only 38,000 new jobs (now revised down to 11,000), June’s blockbuster report from the Bureau of Labor Statistics (BLS) of 287,000 newly created jobs alleviated a great deal of concern regarding the U.S. employment situation.
FIGURE 1: U.S. NONFARM PAYROLLS BY MONTH, JANUARY 2013–JUNE 2016
(Seasonally adjusted, in thousands)
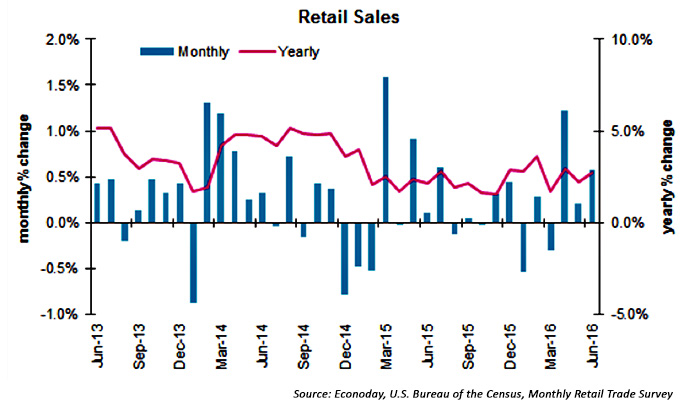
Retail sales—Data released last week indicated a major beat versus expectations for retail sales data, continuing a string of reports for 2016 that have surpassed analyst projections more often than not. Total retail sales for June came in with a 0.6% jump versus year ago, well above the forecast for a 0.1% increase.
FIGURE 2: MONTHLY RETAIL TRADE SURVEY
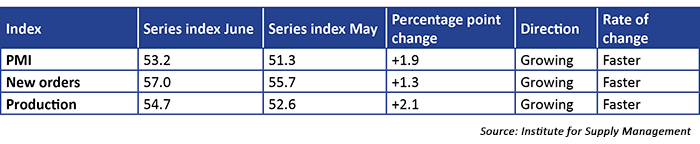
Manufacturing—Industrial production rose more in June than it has in 11 months, and economic activity in the manufacturing sector expanded in June for the fourth consecutive month, according to the Institute for Supply Management (ISM).
FIGURE 3: ISM JUNE 2016 TOPLINE MANUFACTURING DATA
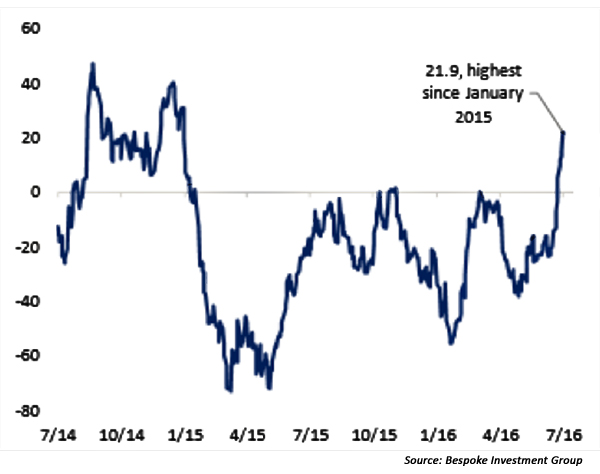
Economic Surprise Index—Says Bespoke Investment Group, “The running total of stronger than expected data has resulted in the highest reading for the Citi Economic Surprise Index since January of 2015. It’s now firmly in positive territory for the first time since Q4 of that year, and GDP growth expectations have risen following a very weak Q1 print.”
FIGURE 4: CITI ECONOMIC SURPRISE INDEX, LAST 2 YEARS