

Since mid-January of this year, the indexes and most of their components have been in a sideways technical formation called a “trading range.” A trading-range market condition is simply a wide sideways price action that moves between a low and a high price, looping up and down repeatedly.
This can cause confusion, frustration, and uncertainty for nontechnical investors. By studying a chart, this confusion about price direction can be alleviated. The chart clearly shows the nature of the sideways pattern and gives you information that is vital to long-term investing.
A trading range is a type of correction. The stock market was showing signs of speculation from late 2016 through January 2018. At some point, buyers tend to evaporate as all of the money available (according to investors’ risk appetite) at that point in time has been placed. The result is either a downward or a sideways correction.
The following S&P 500 chart is a weekly chart. This provides three to five years of data and helps investors see the overall trend of the past couple of years as well as the current trend. In 2015, the market had an intermediate-term correction that ended in 2016. This started with a tighter sideways pattern called a “platform candlestick pattern” and resulted in a shallow correction pattern.
WEEKLY CHART OF THE S&P 500
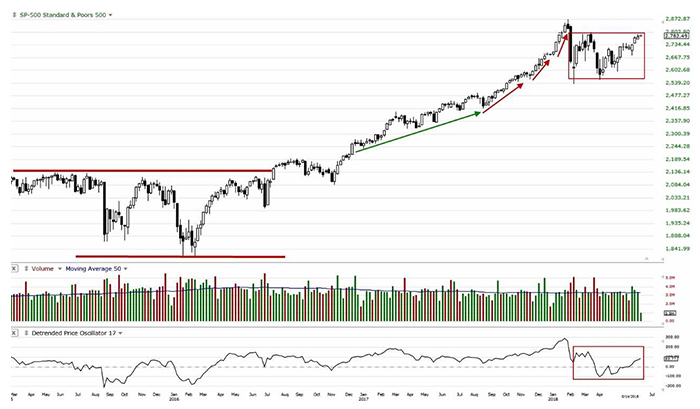
Source: technitrader.com and stockcharts.com, data from the week of 6/11/18.
Then the index moved up with steady gains until late 2017 to early 2018, when speculation rose as new investors rushed to buy stocks. The final gains were unsustainable due to the extreme “angle of ascent.” The result was a sudden collapse of component prices that caused the index values to decline quickly. Since then, the index has been stuck in a sideways or trading-range formation. This type of correction can continue for many months. Relational technical analysis of this chart requires studying more than just the value of the index and the trend. (Relational technical analysis is a proprietary methodology that our firm has developed and includes many elements of both technical and fundamental analysis.)
Volume (the number of shares exchanging hands per week) is reasonably consistent, but when the value rises for an index or price rises for a stock, then volume needs to increase also. If it remains flat or declines, the sudden collapse of value or price is inevitable. The market requires buoyancy of more and more buyers. This is one reason why it is important to study the chart.
Another factor is the cycle indicator called the Detrending Price Oscillator (DPO). This indicator detrends the value of the index revealing the cycle. A common cycle that many investors assume exists is the four-year presidential cycle. This cycle theory claims that the stock market cycles up and down in relation to every presidential election and subsequent four years in office.
However, we believe that cycle has not existed for many years. Looking at the DPO indicator at the bottom of the chart above, no clear four-year cycle has occurred in recent years. In fact, the cycle fails to peak or trough properly until early 2018, when a deviated peak formed. This also was important to note as such peaks often precede a correction downward. A deviated peak is a peak that extends far beyond the normal range for that index, stock, or industry sector. A deviated peak warns that the time line of the cycle has extended and lengthened. The deviated peak pattern also warns that the cycle is extreme and therefore a deeper trough is more likely to occur. This is precisely what happened earlier this year and now has evolved into a trading-range market.
The opinions expressed in this article are those of the author and do not necessarily represent the views of Proactive Advisor Magazine. These opinions are presented for educational purposes only.
 Martha Stokes, CMT, is the co-founder and CEO of TechniTrader and a former buy-side technical analyst. Since 1998, she has developed over 40 TechniTrader stock and option courses. She specializes in relational analysis for stocks and options, as well as market condition analysis. An industry speaker and writer, Ms. Stokes is a member of the CMT Association and earned the Chartered Market Technician designation with her thesis, "Cycle Evolution Theory." www.technitrader.com
Recent Posts: