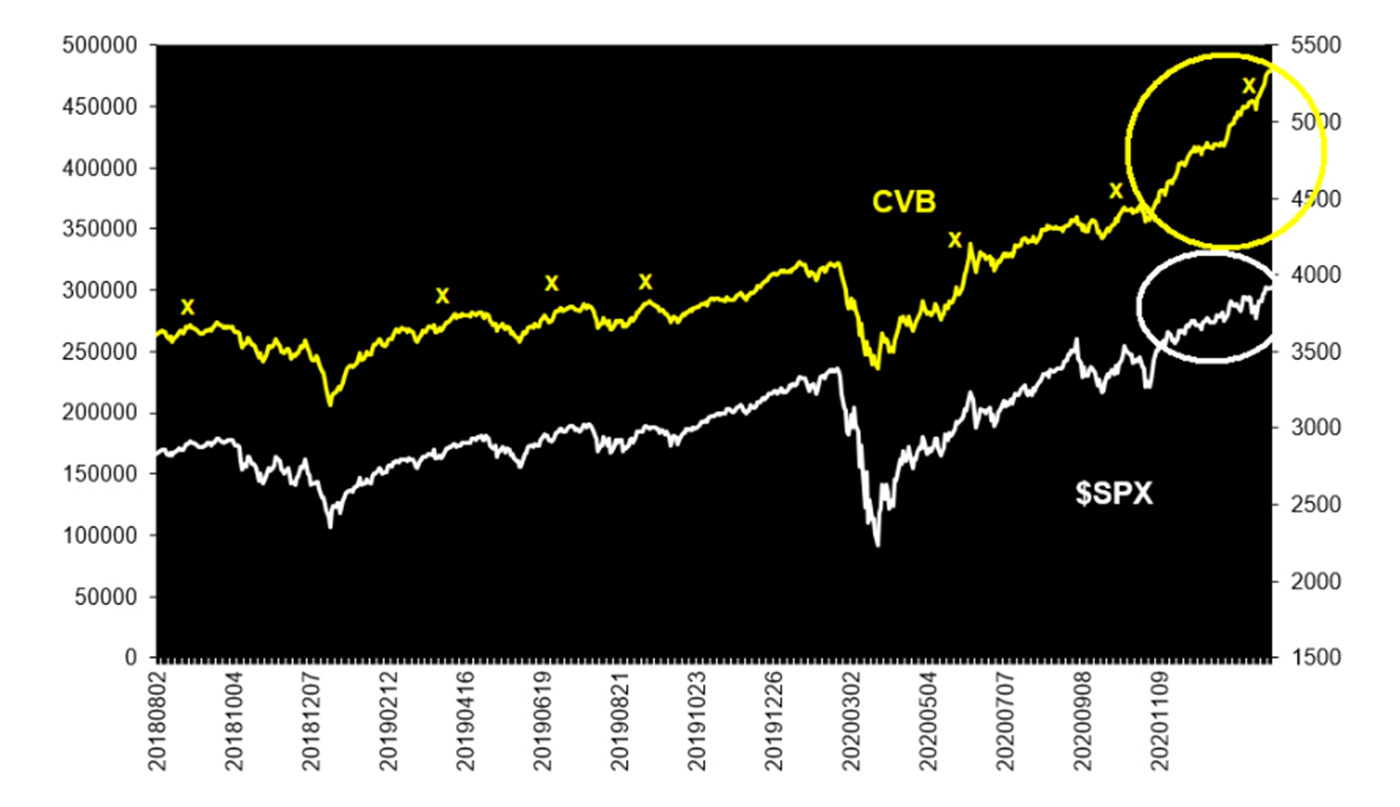

One of the cumulative breadth indicators that we follow is cumulative volume breadth (CVB). It is the running daily total of volume on advancing issues minus volume on declining issues. While it can be calculated using NYSE and NASDAQ data, we prefer using “stocks only” data (i.e., all stocks on which listed options are traded in the U.S.).
As we have pointed out for some time, when CVB makes a new all-time high ahead of $SPX, $SPX will follow. This has been true in every case since 2000, which is as far back as our data for this indicator goes.
Most recently, $SPX suffered a minor pullback in January, dropping from its high of 3,870 on Jan. 26 to as low as 3,694 on Jan. 29. Jan. 27 was a particularly nasty day that week. $SPX was down 100 points that day, but CVB closed at a new all-time high anyway. Apparently, there was very heavy volume on the few advancing stocks of that day. That was a “prediction” that $SPX would also trade at a new all-time high, which it did on Feb. 4.
That is a short-term example, but some of these are much longer term. For example, in the summer of 2020, when the market was coming out of the depths of the COVID-related bear market that bottomed in March 2020, CVB moved to a new all-time high on June 5, 2020, when $SPX was at 3,193. At that time, the all-time high for $SPX was 3,393, set on Feb. 19, 2020. That was a 200-point gain signaled by the indicator (3,193 to 3,393) on June 2020, and it was fulfilled on Aug. 18.
However, the point of this article is not solely to recount the predictive ability of CVB, other than to note the most recent occurrence in late January. Rather, we want to highlight its most recent, extremely strong performance.
Since we don’t have a record of this happening before, I have no idea if this is predictive or not: CVB has been on a literal rip lately, making new all-time highs on 23 of the last 27 trading days (as of Feb. 12) and completely outpacing $SPX (or any other major index for that matter).
The following chart shows the CVB indicator in yellow and $SPX in white. The small x’s on the chart are points where CVB made a new all-time high in advance of $SPX doing so.
The most recent action is shown on the right side of the chart. Note the steepness of the advance in CVB (yellow circle) versus the much more modest slope on the advance of $SPX (white oval).

Source: Option Strategist
Clearly, this is a sign of strength in the current state of the stock market. And it is often the case that when indicators get very overbought, it is bullish for the market (for example, nearly every indicator we had was overbought by the end of January 2019, and that advance carried on for another year from there). It is hard to say whether that is the case with this indicator since we haven’t seen it this strong before. But I would think that there is a reasonable chance that CVB is telling us there is more to come on the upside from the broad stock market.
Of course, that doesn’t mean that we would ignore other indicators, or even necessarily trade on this indicator’s rather vague signal.
But it does mean that we would certainly not be looking for arcane reasons to short this market. Stick with a long position, and be cautious of sell signals around those positions unless $SPX breaks support—which, according to this strength in CVB, might not be for some time to come.
The opinions expressed in this article are those of the author and do not necessarily represent the views of Proactive Advisor Magazine. These opinions are presented for educational purposes only.
This is an edited version of an article that was first published at optionstrategist.com on Feb. 12, 2021.
 Professional trader Lawrence G. McMillan is perhaps best known as the author of “Options as a Strategic Investment,” the best-selling work on stock and index options strategies, which has sold over 350,000 copies. An active trader of his own account, he also manages option-oriented accounts for clients. As president of McMillan Analysis Corporation, he edits and does research for the firm’s newsletter publications. optionstrategist.com
