The financial media was largely focused last week on speculation about Nvidia’s upcoming fourth-quarter earnings report—and then what Seeking Alpha referred to as the “blowout quarterly earnings results and strong guidance after the closing bell Wednesday.” Seeking Alpha further noted, “‘Insatiable demand’ for the company’s artificial intelligence chips lifted the stock more than 16%, leading the company to briefly surpass a $2 trillion valuation, and helped propel the broader market.”
The Wall Street Journal wrote about the company’s meteoric stock price gains, “Nvidia has risen to become the third-most-valuable U.S. company. … A year ago, it was ranked seventh, with a market value of nearly $600 billion.”
FIGURE 1: NVIDIA (NVDA) VS. S&P 500 AND PHLX SEMICONDUCTOR INDEX

Sources: FactSet, The Wall Street Journal
MarketWatch further quantified the spectacular nature of Nvidia’s growth, comparing the company’s financial performance to that of the rest of tech’s “Magnificent Seven.” It noted that the following chart (Figure 2) shows how “Nvidia’s earnings—or, to be more precise, analyst expectations of its earnings in 12 months’ time—have soared well beyond its stock price, leading actually to a 102-point multiple contraction over the last two-plus years.”
FIGURE 2: NVIDIA FAR SURPASSES ‘MAGNIFICENT SEVEN’ IN EARNINGS GROWTH, WHILE MULTIPLE CONTRACTS

Sources: Carson Investment Research, FactSet
Barron’s added, “There’s no precedent for this kind of growth at a tech company as large as Nvidia. For bullish investors—and executives—it speaks to the power of AI [artificial intelligence]. ‘Accelerated computing and generative AI have hit the tipping point,’ Nvidia CEO Jensen Huang said during the company’s earnings release. ‘Demand is surging worldwide across companies, industries, and nations.’”
What about equity performance for the rest of the market?
A panel discussion this past weekend on Larry Kudlow’s radio program agreed that Nvidia’s future revenue growth and earnings—and that of other companies with AI exposure—is hard to quantify, given the seemingly unlimited potential of AI applications. However, the panel also pointed out that the broad market rally led by Nvidia and other tech stocks was not translating into equally strong performance for many segments of the overall equity market.
Barron’s agreed with this observation in a recent article:
“Nvidia’s exponential growth and positive financial forecasts have propelled its stock to yet another new high, making the S&P 500 ever more reliant on the fate of a single semiconductor manufacturer. … That means 28% of the S&P 500‘s gains—nearly $2.7 trillion year to date—came from just one stock. Meta Platforms accounted for 12%, followed by Microsoft and Amazon.com with 10% and 9%, respectively.”
FIGURE 3: MEGA-CAP TECH DOMINANCE IN S&P 500 INDEX GAINS

Sources: Barron’s, FactSet, Dow Jones market data
Bespoke Investment Group recently took a deep look at the performance of AI-related versus non-AI-related stocks in the S&P 500:
“A few weeks ago, we built out a list of ‘AI’ stocks in the S&P 500 by looking at eight popular AI ETFs and finding any S&P 500 names that were included in them. There were 67 stocks out of the 500 that fit the bill, which gives us a good way to compare large-cap AI stocks versus the rest of the index. As shown in the [following chart], since ChatGPT shocked the world with its product release on 11/30/22, the 67 S&P 500 AI stocks have averaged a gain of 45.1%. The remaining 433 stocks in the index have only averaged a gain of 8.08% over the same time frame.”
![]() Related Article: How AI is reshaping the landscape of financial planning
Related Article: How AI is reshaping the landscape of financial planning
FIGURE 4: S&P 500 STOCKS—AVERAGE % CHANGE SINCE CHATGPT (11/30/22)

Sources: Bespoke Investment Group
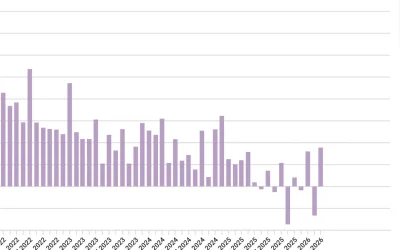
Bespoke further points out that while major market indexes have been making all-time highs, the percentage of stocks above their 50-day moving averages is less than 70%. Bespoke adds, “This is just another way of showing that a small number of stocks are driving a lot of the S&P’s performance, but it also means there’s plenty of upside for a good chunk of stocks that haven’t been participating as much over the last few months.”
FIGURE 5: S&P 500 AND PERCENTAGE OF STOCKS ABOVE 50-DMA (PAST FIVE YEARS)

Sources: Bespoke Investment Group
RECENT POSTS