The number of traded stocks is shrinking
The number of traded stocks is shrinking

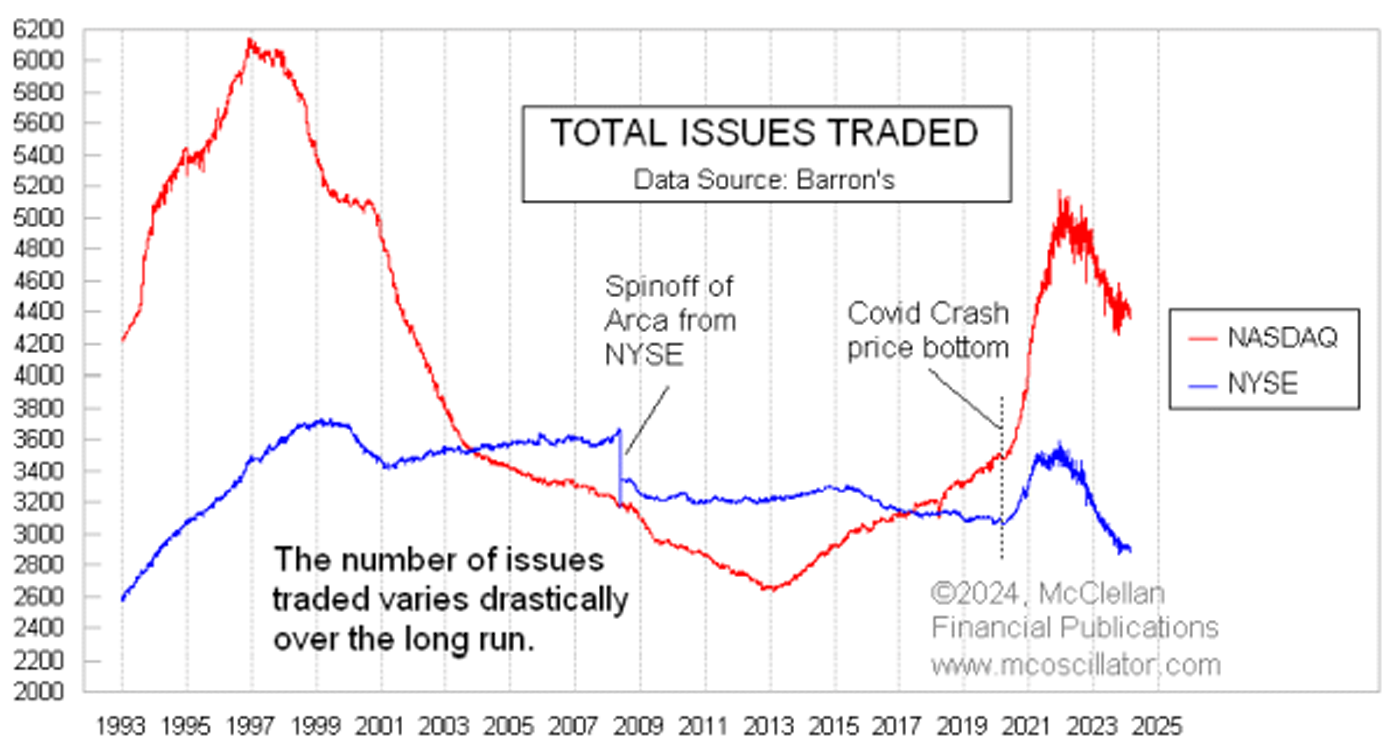
The major averages may still be trending higher, but the total numbers of issues traded on the NYSE and NASDAQ peaked back in January 2022 and have been declining since then. This is not a bullish sign for the financial markets.
FIGURE 1: TOTAL NUMBER OF ISSUES TRADED ON NASDAQ AND NYSE

Sources: Barron’s, McClellan Financial Publications
The NASDAQ market has looser listing standards than the NYSE, and so it attracts a larger number of total listings. But the ease of doing an IPO on the NASDAQ sometimes means marginal companies that should not go public do so anyway and then struggle afterward. For that reason, the advance-decline (A-D) statistics for the NASDAQ have always had a bearish bias. In fact, the cumulative daily A-D line for the NASDAQ has never made a new all-time high. It started going down from the beginning of the data in 1972, and it has never gotten back to that level, despite having more issues traded.
Having more IPOs can be a sign of an expanding economy. Perhaps it is better to say that expanding IPOs is a sign of easy money, such that even the marginal companies can still attract the capital to have a successful IPO. That increases the number of listed issues.
When the Federal Reserve started QE4 during COVID, and Congress threw its own pile of cash at the economy, there was so much money sloshing around that the NASDAQ listings grew significantly. The number of issues traded rose from 3,500 around the time of the COVID low in March 2020 to a high of 5,175 in January 2022. The NYSE’s total number of listed issues also grew at that time, although not by quite as much.
Now both are shrinking, as the marginal companies have revealed themselves and gotten delisted. Mergers and acquisitions also play a smaller part in the shrinkage.
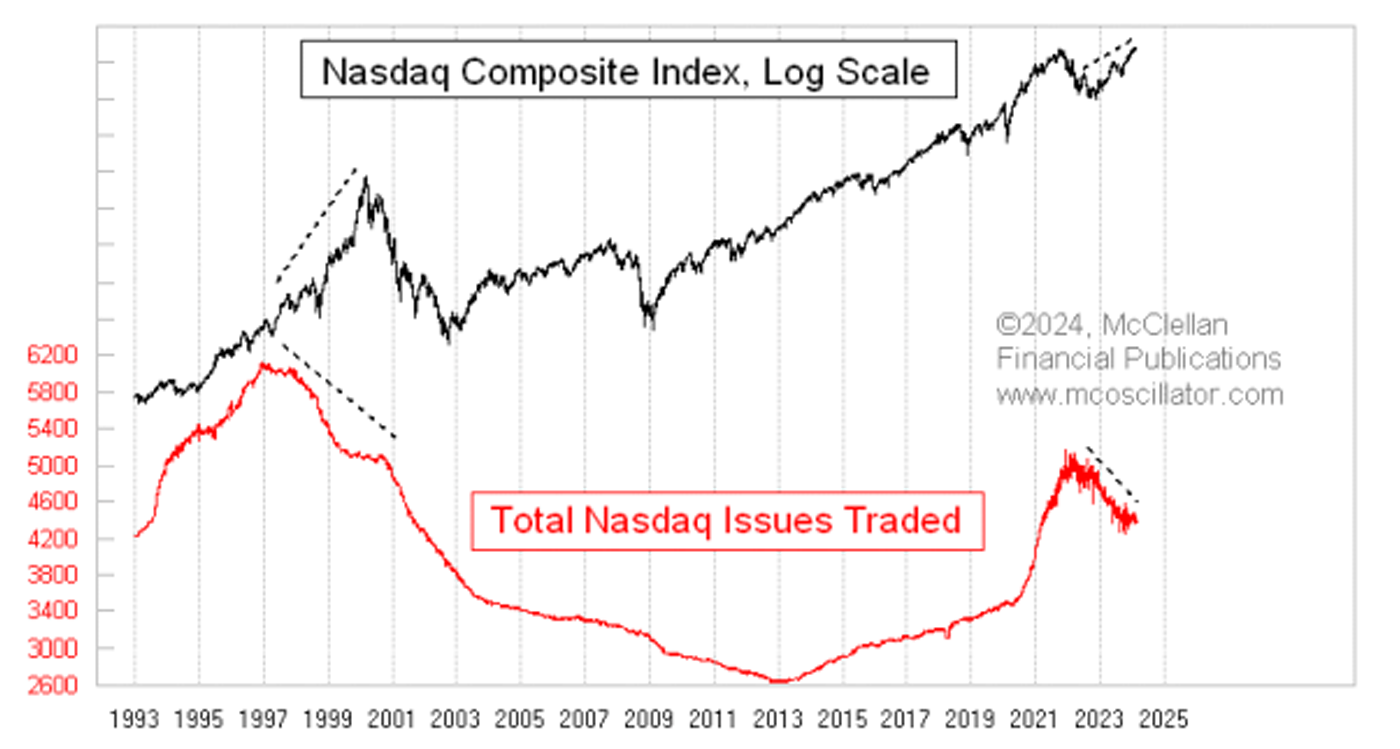
One reason why this is meaningful is that a similar shrinkage in listed issues occurred leading up to the top of the dot-com bubble in 2000. The high point for NASDAQ issues traded was actually back in December 1996, at 6,136. By the time prices peaked for the NASDAQ Composite Index in March 2000, the number of NASDAQ issues traded was down to 5,100, and it continued to decline.
FIGURE 2: NASDAQ ISSUES TRADED VS. NASDAQ COMPOSITE PRICE TREND

Sources: McClellan Financial Publications
One challenging aspect of divergences is that they can last for a while, and they won’t tell us when they are finally going to matter. But it cannot be seen as good news that money to invest is drying up, and the weak issues are getting picked off. In the stock market, decreasing liquidity initially goes after the weak. But those same liquidity issues often end up impacting even the biggest and supposedly most well-capitalized companies eventually.
The opinions expressed in this article are those of the author and the sources cited and do not necessarily represent the views of Proactive Advisor Magazine. This material is presented for educational purposes only.
This is an edited version of an article that first appeared at McClellan Financial Publications on April 18, 2024.
 Tom McClellan is the editor of The McClellan Market Report newsletter and its companion, Daily Edition. He started that publication in 1995 with his father Sherman McClellan, the co-creator of the McClellan Oscillator, and Tom still has the privilege of working with his father. Tom is a 1982 graduate of West Point, and served 11 years as an Army helicopter pilot before moving to his current career. Tom was named by Timer Digest as the #1 Long-Term Stock Market Timer for both 2011 and 2012. mcoscillator.com
RECENT POSTS


