

Lest we forget, it was only days ago that the latest Greek drama held the market’s attention. While the decline didn’t turn out to be meaningful this time around, the fear that Greece’s new left-wing, anti-austerity party would do something really stupid, and blow up the eurozone in the process, was the talk of the town and wound up holding stocks hostage.
But then the stupidity ended as Alexis Tsipras and friends figured out they held no chips, and the latest in a long line of Greek worries ended. As one might have expected, stocks then breathed a sigh of relief and moved back up toward all-time highs. However, as has been the trend for quite some time now, whenever the S&P approaches its high-water mark, traders tend to find a reason to go the other way. So as the S&P flirted with a fresh new high on July 20, I wrote that it was likely time to cue the negative news again.
Sure enough, traders wasted little time in moving on to the next worry, and the major indexes started to cycle down through their 2015 range again. Just a few days after it looked as if the bulls might be attempting a comeback, fear is back in the game.
So, what gives? Why did traders once again freak out and send stocks down in earnest? See if you can’t spot the problem in the chart.
COMMODITIES DROP TO A 13-YEAR LOW
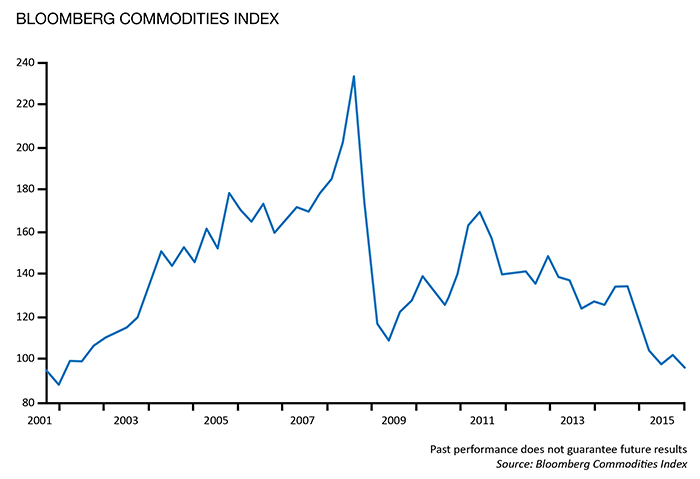
While much of the focus has been on the recent downtrend in oil prices, which just hit fresh weekly lows, almost all of the commodities sector has been taking it on the chin. It matters little what chart you look at: steel, copper, etc.
Should we blame commodity weakness on the strength of the U.S. dollar? My answer is: “Wait a second, not so much.” After comparing the chart of the dollar to the rest of the commodities, it becomes quite clear that commodities were a problem long before the big spike in the dollar. And the fact that the dollar is not breaking to new highs as commodities are breaking to new lows suggests that the greenback is not the sole culprit here.
The bottom line appears to be that the combination of slowing global growth (look no further than China) and the end of the secular bull market in commodities is the real problem.
So, is this the big one? Will an ongoing decline in commodities soon infect the stock market? Is this the real problem that will lead to the crunch in stocks that everyone on the planet seems to be waiting on? To review, we are not seers of all things global macro. We do not invest based on an opinion or point of view. No, we prefer to let the weight of the indicator evidence guide us. And on that score, with commodities breaking down, high yields struggling, and three of our four long-term risk-management models all waving warning flags, we will continue to say that risk remains elevated at this time.
The opinions expressed in this article are those of the author and do not necessarily represent the views of Proactive Advisor Magazine. These opinions are presented for educational purposes only.
 David D. Moenning is chief investment officer at Sowell Management Services, an independent RIA firm focused on modern portfolio diversification. Mr. Moenning has been a full-time money manager since 1987 and is also the founder of Heritage Capital Research. Mr. Moenning is a former president and chairman of the National Association of Active Investment Managers (NAAIM). heritagecapitalresearch.com