

Cycles occur in nature as well as in the institutions developed by humans.
Every investor is currently wondering how long the U.S. economy will be shut down and the impact it will have on their lives, jobs, businesses, and futures. Of course, the priority must be saving lives. But then, how long will it take for the stock market to recover and the economic recession to end?
JPMorgan Chase said its economists are estimating that unemployment will hit 20% in the second quarter. However, that likely does not fully include the 16 million self-employed or the more than 30 million small-business owners who may not qualify for unemployment benefits, and thus are not well represented in the unemployment numbers.
Overlaying a pandemic “time line” with the Dow Jones Industrial Average (DJIA) Index gives investors a graphical perspective of what has happened in the past and what is most likely to happen in the future. Technical and cycle analysis is not a predictive tool. The future is not set in stone with a pandemic and an economic shutdown that is a historical first, with continual changes altering data rapidly.
However, the chart of the Dow 30, which is the oldest data set for the U.S. stock market, has some repetitive historical patterns that provide some glimpse of what is probable.
The first pandemic recorded with the Dow 30 data is the Spanish flu, which occurred from 1918 to 1920 and greatly affected many nations during WWI and beyond. It infected an estimated 500 million people—about a quarter of the world’s population at the time. While there is some debate about where the Spanish flu originated, it took a heavy toll on the American “doughboys,” both in U.S. military camps and abroad. This is the longest and worst pandemic in the data set used.
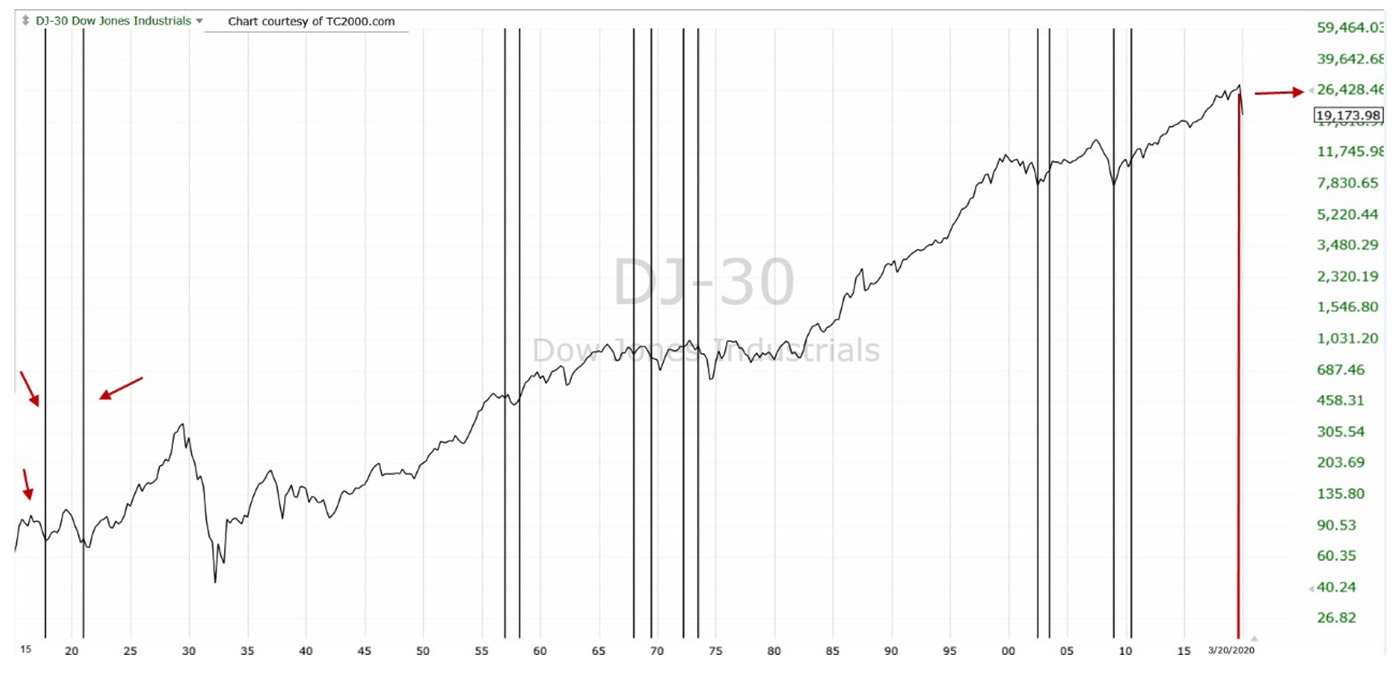
Note: The “boxed” number represents the DJIA close as of March 20, 2020. The DJIA closed at a low of 18,591.93 on Feb. 23, 2020, and at an all-time high of 29,551.42 on Feb. 12, 2020.
Source: TechniTrader analysis, market data provided through TC2000.com
As you can see in the previous chart, with the Spanish flu first having its greatest impact on Europe, the U.S. stock market rallied in 1918 through September 1919. (The Treaty of Versailles was signed on June 28, 1919.) Then, as our soldiers came home from abroad, the pandemic hit the U.S. hard and quickly overwhelmed the nation, the economy, and the health-care system of that era. The Dow fell sharply before recovering in the early and mid-1920s.
Subsequent pandemics or epidemics occurred in the late 1950s (1957–1958 “Asian flu”), 1960s (1968–1969 “Hong Kong flu”), mid-1970s (1972–1976, continued variants of the Hong Kong flu and the largely controlled “swine flu” scare), early 2000s (SARS), and 2008–2010 (new strain of H1N1).
There is a close correlation between an epidemic or pandemic and most, but not all, bear markets. However, these elements aren’t part of a connected cycle. In 1929, the worst stock market crash and the deepest and longest depression did not have a pandemic occur during that time.
Some pandemics have triggered a bear market, while others have started during a bear market.
However, most of the pandemics and bear market cycles have one thing in common: Once the pandemic ended, a bull market began shortly thereafter. The exception is in the late 1960s and early 1970s, a period that also included the Vietnam War, the oil crisis of 1973, and skyrocketing inflation in the middle of the 1970s. Several factors, therefore, delayed a bull market by more than a decade.
Studying this combination of pandemic cycles and Dow Jones Industrial Average Index cycles provides a great deal of information for investors:
- The bear market will often end suddenly, and opportunities for low-risk investing will occur. The pandemic may continue somewhere in the world, but the U.S. market will usually recover at a fairly rapid pace.
- The “new bull” after many pandemics is strong, with new technologies emerging more rapidly due, in part, to new needs and solutions to problems the pandemic created.
- All pandemics do end. All bear markets have a three-phase cycle of “denial, disbelief, and capitulation.”
- New technologies will flourish, and the economy will tend to have an extended growth cycle (most, but not all, of the time).
Bear market and pandemic cycles align rather closely. However, not all pandemics are a core factor in creating a bear market, and numerous other factors come into play.
We focus on 12 key “barometers” or data sets indicating the likelihood of conditions for a bear market. These include (a) various measures of consumer, corporate, and government debt; (b) excessive risk-taking by institutional and retail investors; (c) interest-rate policy and employment/wage trends; (d) stretched market and company valuations; (e) bond inversions; (f) excessive corporate stock buybacks; and (g) geopolitical factors and economic cycles. All 12 have surfaced leading up to the current bear market.
The bottom line from our perspective? Every pandemic tends to be closely associated with a bear market, but not every bear market has a pandemic.
 Martha Stokes, CMT, is the co-founder and CEO of TechniTrader and a former buy-side technical analyst. Since 1998, she has developed over 40 TechniTrader stock and option courses. She specializes in relational analysis for stocks and options, as well as market condition analysis. An industry speaker and writer, Ms. Stokes is a member of the CMT Association and earned the Chartered Market Technician designation with her thesis, "Cycle Evolution Theory." www.technitrader.com