When I started developing a mutual fund selection and trading system in the mid-1980s, I wanted to own the funds that were going up and avoid the ones going down. Therefore, I quickly gravitated toward price momentum as an indicator and selection tool. One of the first things I noticed was that typical momentum indicators are very noisy. A 21-day momentum measurement is determined from just two data points—the current price and the price 21 days ago. For example, if Fund A had a $20.00 price 21 days ago and it is $21.00 today, then its 21-day price momentum is 5.0% (percentage change of price over 21 days).
Problems arise when the two price points used in the calculation move in different directions the following day. Suppose that after one additional day of market action the current price goes up a nickel to $21.05 and the look-back price drops to $19.00. Even though Fund A is still on the same trend and has the same momentum as the day before, its 21-day price momentum calculation has now more than doubled to 10.8%. This becomes especially troublesome when using the calculation as a ranking and selection mechanism across multiple fund choices. The daily noise in Fund A may be in the opposite direction of Fund B, leading to inaccurate comparisons and unnecessary trading.

Source: AllStarInvestor.com
One way to reduce such rapid variations is to use a moving average of the 21-day momentum reading. While this will indeed make the indicator less volatile, it also introduces an undesirable lag. Instead of applying a moving average to the 21-day percentage price difference, my approach is to calculate the momentum between the current price and its moving average. This allows the most recent data (today’s price) to be used without any lag while smoothing out the historical data and in turn smoothing the momentum calculation. Applying this to our previous example, instead of using the price from 21 days ago as the reference point, I would use a 42-day moving average as the reference point. Since the 42-day moving average is probably not going to move more than five cents per day in this example, our following-day momentum calculation will still be very close to 5.0%.
I was using this momentum approach for about a dozen years to choose sector funds and typically just referred to it as my selection methodology. Then I came across a 1998 article in “Technical Analysis of Stocks & Commodities” by Rudy Stefenel. He described an “anchored momentum” indicator that used a moving average as the reference for deriving momentum, thereby anchoring it to that moving average rather than a single day’s closing price. I liked the name and description and have been referring to this as “anchored momentum” ever since.
Anchored momentum can be used with any data interval (daily, weekly, monthly, etc.) and a wide range of periods (20, 50, 200, etc). I used the 21-day and 42-day example above purely for discussion, and many people would consider them relatively short-term in nature. Long-term traders might want to use 50-week or 200-day anchored momentum, and intermediate-term traders are more likely to be successful with other values.
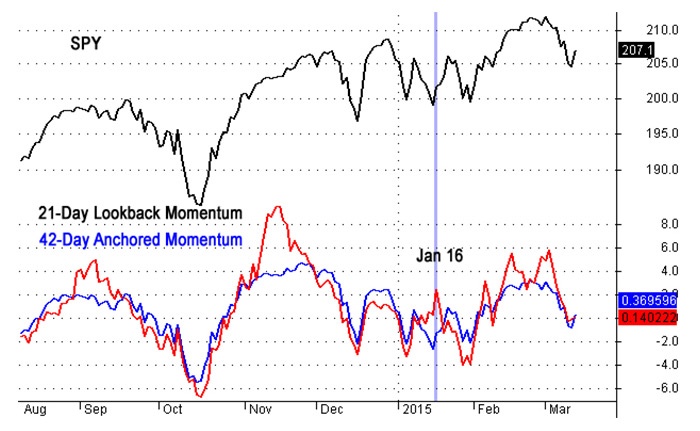
The included chart shows the SPDA S&P 500 ETF (SPY) over a recent six-month period. On January 16, the traditional look-back momentum indicator in red registered an interim peak. This is clearly a false indication of a short-term peak in momentum, because the SPY was actually establishing a short-term low at that time. The anchored momentum indicator in blue does a much better job of handling this volatility and accurately reflecting the changing market conditions. This is why I always prefer using anchored momentum in my security analysis.
The opinions expressed in this article are those of the author and do not necessarily represent the views of Proactive Advisor Magazine. These opinions are presented for educational purposes only.
