Sunspot cycle signals a big upturn in unemployment
Sunspot cycle signals a big upturn in unemployment

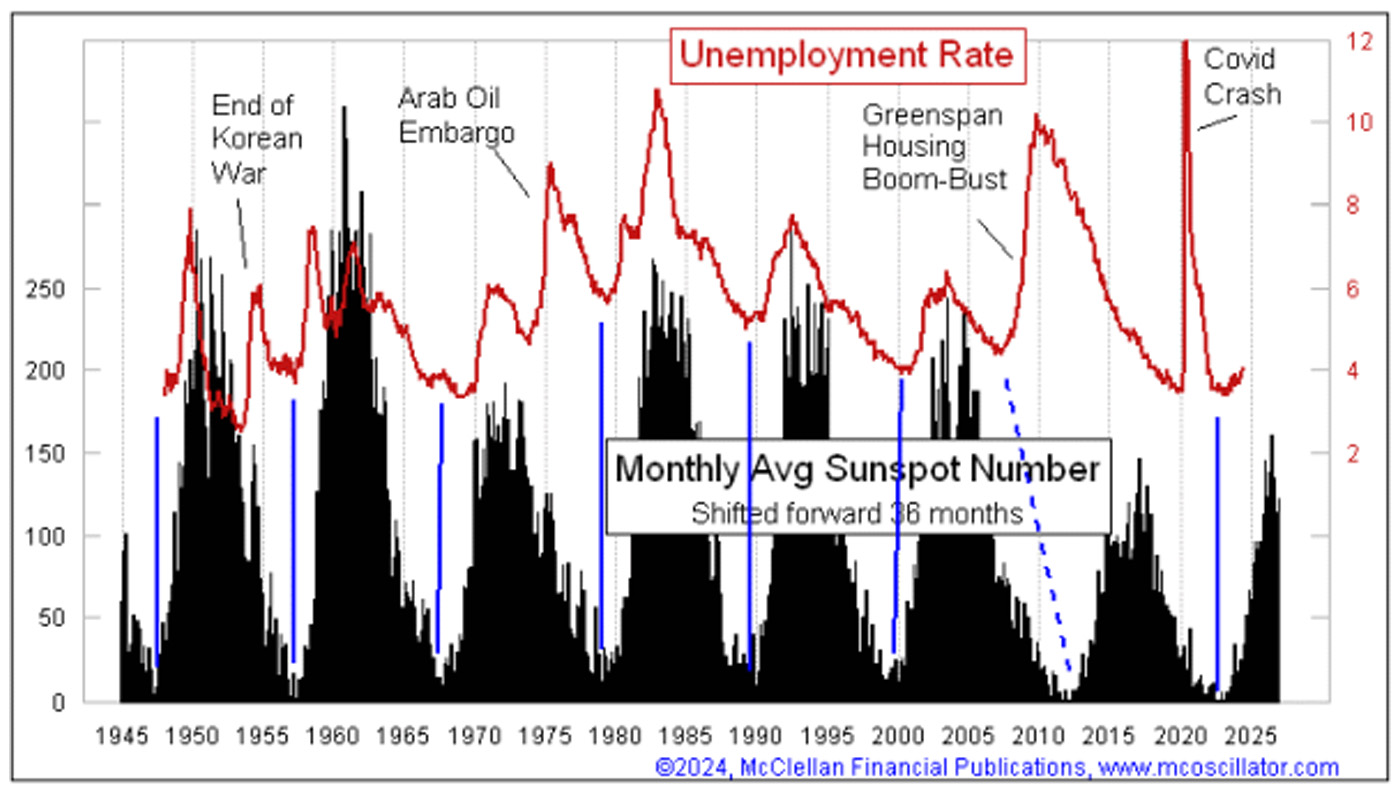
Many may resist accepting the message of this week’s chart (Figure 1), but I am going to share it anyway. It shows a strong positive correlation between the U.S. unemployment rate and the monthly sunspot count. The trick is that I am using a 36-month forward offset to help us see that relationship.
FIGURE 1: UNEMPLOYMENT TRENDS COMPARED TO THE SUNSPOT CYCLE

Source: McClellan Financial Publications
We only have reliable data on the unemployment rate (U-3) going back to 1947, when the Bureau of Labor Statistics (BLS) began collecting it, though some unofficial sources have attempted to quantify earlier rates. It is interesting that government statisticians started reporting after post-WWII layoffs were done and people were getting back to work again.
The sunspot cycle averages about 10.6 years and has been pretty consistent since the invention of reliable telescopes back in the 1700s. During the period for which we have data on the unemployment rate, the sunspot minimum has consistently preceded a bottom in the unemployment rate by about three years (see the three-year time offset between the two plots in Figure 1).
This relationship was significantly disrupted in one instance: the collapse of Greenspan’s housing bubble starting in 2005, which arguably moved the unemployment rate’s low point forward a few years. Other big geopolitical events, like wars and the Arab oil embargo, have caused more minor disruptions along the way. The COVID spike in unemployment also deviated from this pattern, but the relationship seems to be returning to its usual rhythm.
![]() Related Article: The yield curve’s 15-month lag
Related Article: The yield curve’s 15-month lag
It’s natural to wonder why this relationship exists. I don’t have a good answer, other than to note that I have previously reported on the weak positive correlation between sunspot numbers and the stock market.
I have also noticed that sunspot numbers influence several climate data series. For example, global hurricane counts are negatively correlated with sunspot numbers, so the upcoming decline in sunspot counts before the next solar minimum should mean we will see a natural rise in global hurricane (and typhoon) counts over the next few years.
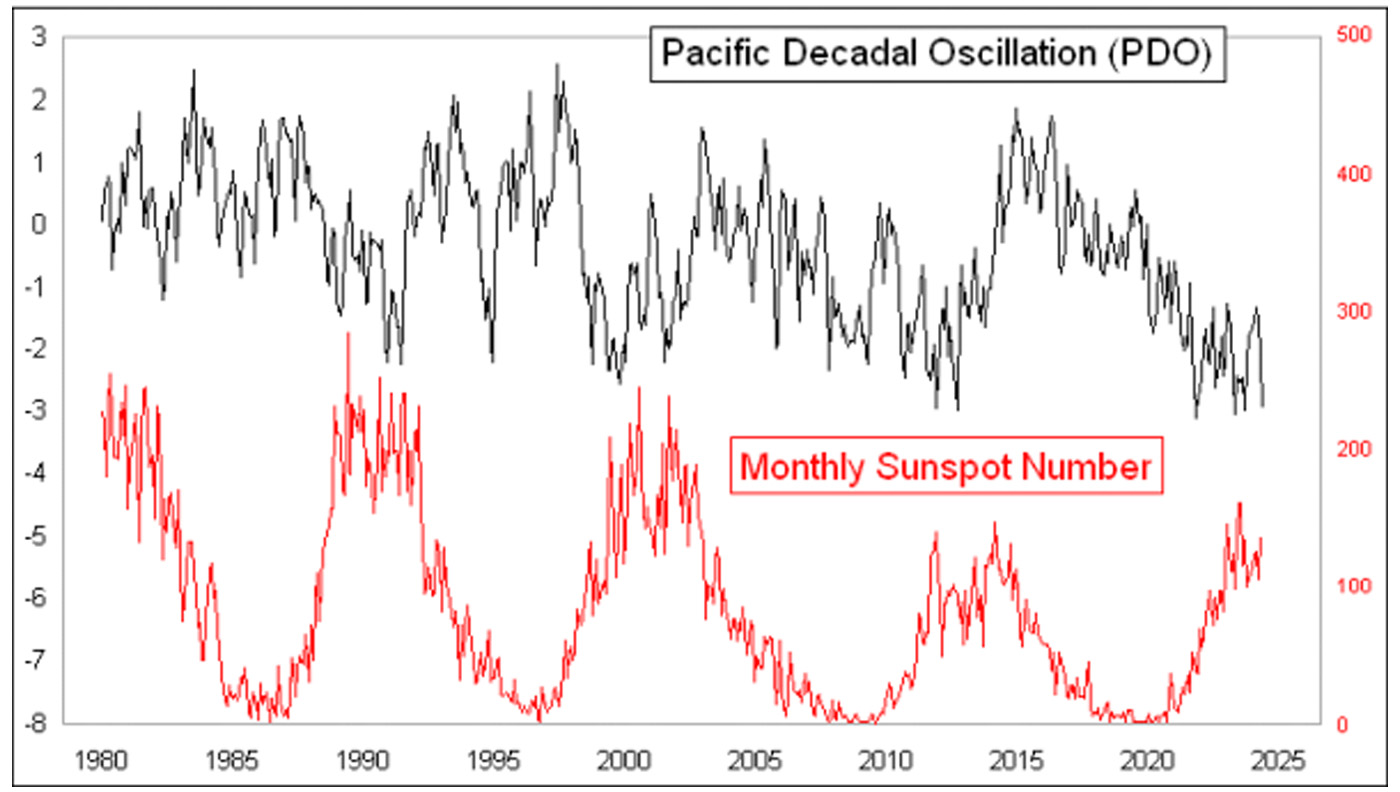
Sunspots are also negatively correlated with the Pacific Decadal Oscillation (PDO), which reflects anomalies in sea surface temperature in the Pacific Ocean and is tied to the El Niño/Southern Oscillation (ENSO) cycle. Changes in the PDO are strongly correlated with several climate phenomena, such as rainfall where I live in the Pacific “Northwet.” The low PDO numbers in recent years explain the persistently below-normal rainfall totals we have been having.
FIGURE 2: PACIFIC DECADAL OSCILLATION (PDO) COMPARED TO THE SUNSPOT CYCLE

Source: McClellan Financial Publications
How that relates to the unemployment rate is a lot harder to tease out of the data, and I don’t have a satisfying answer to explain the linkage. What I do have is almost 80 years of data showing that the relationship holds for the most part. Sometimes, we can just accept the legitimacy of a phenomenon without fully understanding it.
Other factors will also affect the unemployment rate going forward, perhaps exacerbating or dampening changes suggested by the sunspot cycle. And humans are probably not done having wars and other international conflicts that may affect the unemployment rate episodically. While we probably won’t see a perfect correlation between sunspot numbers and unemployment data, an upward trend in unemployment data over the next few years seems likely. This will be unfortunate for whoever is elected in November—and gets blamed for that rise in joblessness by the press.
The opinions expressed in this article are those of the author and the sources cited and do not necessarily represent the views of Proactive Advisor Magazine. This material is presented for educational purposes only.
This is an edited version of an article that first appeared at McClellan Financial Publications on July 25, 2024.
 Tom McClellan is the editor of The McClellan Market Report newsletter and its companion, Daily Edition. He started that publication in 1995 with his father Sherman McClellan, the co-creator of the McClellan Oscillator, and Tom still has the privilege of working with his father. Tom is a 1982 graduate of West Point, and served 11 years as an Army helicopter pilot before moving to his current career. Tom was named by Timer Digest as the #1 Long-Term Stock Market Timer for both 2011 and 2012. mcoscillator.com
RECENT POSTS


