


The S&P 500 (SPX) was recently down 10% from the January high, broke the 200-day moving average, and finally “whooshed” on a 90% downside price and volume day. We continue to believe the two-month intermediate-term correction for the stock market has been driven by human nature rather than a significant change in our positive fundamental thesis. Why are we so sure this is not a fundamentals-driven peak in the stock market? The reasons for the correction keep changing!
Shifting excuses to explain weakness
Remember, the “shock drop” in early February began with stronger economic data, and a labor inflation reading that was going to drive rates up past 3% in a new secular uptrend. Now we retested that early February low with a second derivative slowing in the global economic data, fear of a trade war, and a meaningful drop in the 10-year U.S. Treasury yield. The excuses for the correction changed, which suggests to us it was more about relieving a historic level of stock market and economic optimism in January than a fundamental change that would warrant a more defensive posture.
Key indicator suggests the stock market whoosh is near an end
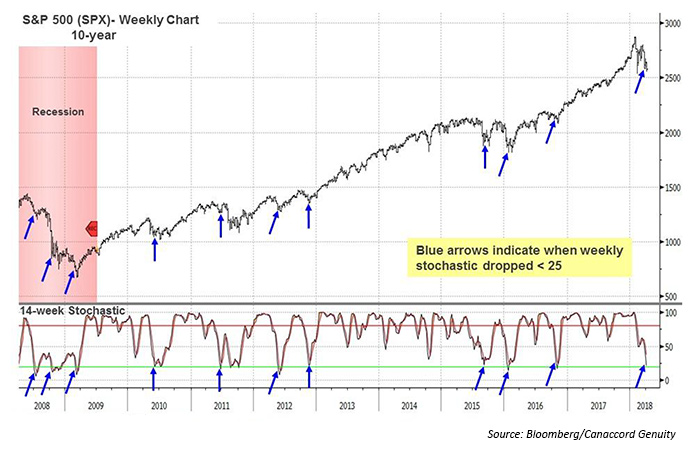
Throughout this year, we have highlighted our expectation for significant volatility in the first half of 2018 in the form of stock market “whooshes” and “ramps.” How does one figure out when a whoosh is coming to an end and a ramp is near? We have four key tactical indicators we frequently highlight, but our favorite intermediate-term indicator is the 14-week stochastic for the SPX. Monday’s (4/2) weakness caused the indicator to drop below 25, which has happened seven times since the 2009 low (Figure 1).
FIGURE 1: SPX WEEKLY STOCHASTIC SUGGESTS BOTTOM IS NEAR
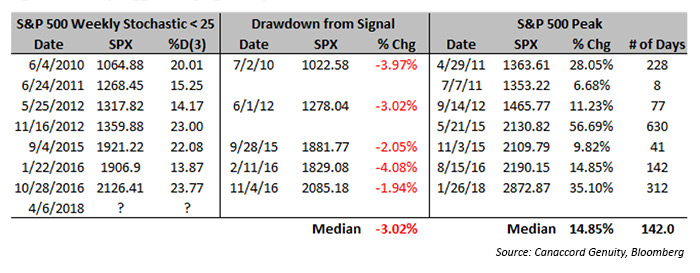
- From the initial drop to below 25 on the weekly stochastic, the median gain was 14.85% over 142 trading days from the weekly close (Table 1). A close below 2,635 would accomplish this.
- The median drawdown from the signal is 3.02% in under a month ranging from 0% to -4%.
- Only 2011 provided a poor intermediate-term entry point for the stock market, but even that was made up quickly.
TABLE 1: HISTORY SUGGESTS BUYING A WEEKLY OVERSOLD SIGNAL
Summary
Is it time to buy the stock market “whoosh” in the bottoming process? It is important to remember that bottoms (and tops) should be considered a process and not a price. Absent an inversion of the yield curve that shuts down credit, each intermediate-term correction feels like the fundamental backdrop is at risk, only to ultimately realize that positive fundamental influences still exist. These include (1) solid global growth, (2) positive domestic activity driving earnings per share (EPS), (3) capital spending improvement, (4) real household median incomes jumping with strong employment, and (5) the demographic-driven push to higher homeownership. We would add to our overweight sectors of financials, info tech, and industrials on a correction while underweighting the defensive areas such as consumer staples, utilities, and telecom.
The opinions expressed in this article are those of the author and do not necessarily represent the views of Proactive Advisor Magazine. These opinions are presented for educational purposes only.
The original version of this report was released on April 3, 2018.
 Tony Dwyer is the head of the U.S. Macro Group and chief market strategist at Canaccord Genuity. He also sits on the firm’s U.S. operating committee. Mr. Dwyer joined Canaccord Genuity in 2012 and is known for the practical application of macroeconomic and tactical market indicators. Mr. Dwyer was previously equity strategist and director of research at Collins Stewart and a member of the firm's executive committee. Mr. Dwyer is a frequent guest on many financial news networks. canaccordgenuity.com