


Editor’s note: Tony Dwyer, U.S. portfolio strategist for Canaccord Genuity, and his colleagues author a widely respected monthly overview of market conditions, technical factors, and future market outlook called the “Strategy Picture Book.” The following provides an excerpt from their March 9, 2018, report on the macro market outlook.
We entered 2018 with the idea there would be periods of increased volatility as a result of historically high market and economic optimism, coupled with historically low Fed-policy fear as measured by the Monetary Policy Uncertainty Index. We see no reason to change our view that as long as an inversion of the yield curve has not shut down credit, and the direction of EPS is going up, we want to use any weakness as an intermediate-term opportunity to add exposure for a move to 3,100 in the S&P 500 (SPX), concentrated in the financials, information technology, and industrial sectors.
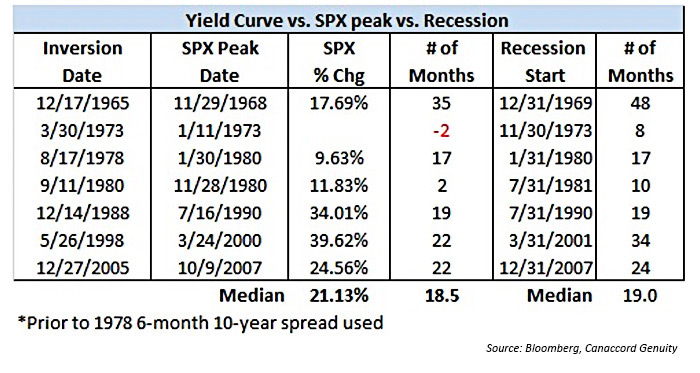
Yield curve shows SPX peak and recession remain years away
It has been nine years since both the economic recovery and bull market began. The length of the recovery always raises the question, “How much longer can this go on?” If any cycle has ever proven there needs to be an inversion of the yield curve to generate a recession given the many headwinds investors have faced, it is this one. In fact, the San Francisco Federal Reserve recently did a study that found the best indicator for recession is still an inversion of the U.S. Treasury yield curve. The current spread between the 2-year and 10-year U.S. Treasury yield is 61 basis points. Clearly, the most recent 12% “shock drop” shows there can be nasty corrections along the way, but history shows (1) “the” peak in the SPX is a median 18.5 months after an inversion, and (2) a recession happens 19 months following the initial inversion (Figure 1). Using the last three cycles that are much more similar to the current, the median months until “the” SPX peak and recession were 22 and 24 months, respectively.
FIGURE 1: ‘THE’ SPX PEAK AND RECESSION COME WELL AFTER INVERSION
High volatility and corrections should still be bought
Our fundamental core thesis remains firmly in place despite the volatility of recent weeks. Sure, there is increased Fed angst, but that should be expected given their dot plot, Fed minutes commentary, and accelerating economic data over recent months. Ultimately, only an imminent credit-driven recession should cause investors to truly adopt and maintain a defensive posture, as the earnings-per-share (EPS) trend would then look to turn negative. If anything, the biggest bump up in long-term interest rates pushes out the negative scenario further into the future.
Time doesn’t end a cycle, credit does—and it is still good
- Inflation trend—Core inflation remains low and stable in a 20-year trading range, with 5-yr “breakevens” trending higher.
- Interest rate outlook—Expect further normalization of Fed policy with 3-4 hikes in 2018.
- Real fed funds rate remains negative, but now trending higher.
- The yield curve should remain in positive territory, depending on the long end of the curve and current consensus.
- The Chicago Fed National Financial Conditions Indices show historically low credit and banking stress in the current environment.
- The Monetary Policy Uncertainty Index is likely to bounce off the historic low.
- Corporate credit demand remains robust, causing record new issuance and historically narrow spreads.
- Economic discussion—We expect continued tailwinds of (a) solid U.S. economic growth based on demographic trends of full employment and increased capital expenditures, (b) continued recovery in the global economy, and (c) the positive impact of fiscal stimulus. Only a real fed funds rate above at least 2%, an inversion of the U.S. Treasury yield curve, and significant stress in the Chicago Fed National Financial Conditions Indices would command a long-term change in our positive economic view.
- EPS highlights—We continue to expect a double-digit EPS growth trend over the coming quarters.
- Valuation overview—The combination of operating earnings P/E and core personal consumption expenditures (PCE) suggests valuations are fair and should continue trending higher.
The opinions expressed in this article are those of the author and do not necessarily represent the views of Proactive Advisor Magazine. These opinions are presented for educational purposes only.
 Tony Dwyer is the head of the U.S. Macro Group and chief market strategist at Canaccord Genuity. He also sits on the firm’s U.S. operating committee. Mr. Dwyer joined Canaccord Genuity in 2012 and is known for the practical application of macroeconomic and tactical market indicators. Mr. Dwyer was previously equity strategist and director of research at Collins Stewart and a member of the firm's executive committee. Mr. Dwyer is a frequent guest on many financial news networks. canaccordgenuity.com