
Shifting seasons
Shifting seasons

What do seasonal patterns say for the remainder of 2014?
For as long as there has been a stock market, amateur and professional analysts have been trying to find correlations between external factors and the performance of markets. These efforts have ranged from the outright silly and coincidental—the Super Bowl Indicator—to the most complex and serious econometric models.
Some such analytic efforts, especially those related to the calendar, may have a basis in real facts and cause and effect. Tax-related issues, business and investment reporting periods, commodity seasonality, political election cycles, and sentiment at various times of the year tend to have shown some repeatable patterns over the years.
With the end of May upon us, what are seasonal forecasts telling us about the outlook for the stock market for the rest of this year? Should any investor or advisor care what they say?
Two Wall Street seasonal adages have shown mixed results so far in 2014.
The famous January Indicator, or January Barometer, was decidedly negative, with the S&P 500 down close to 4% for the month of January. “As January goes, so goes the year” the Street saying tells us.
But does the indicator have any merit? According to Sam Stovall, chief equity strategist at S&P Capital IQ, “sort of.” While a down January does not necessarily predict a negative year, it has relatively strong accuracy in suggesting a less-than-stellar market year.
Since 1945, the S&P 500 has actually risen 56% of the time following down Januarys. That is lower than the 84% frequency of February-through-December gains following a higher market in January, but still barely positive.
According to data compiled by The Wall Street Journal, in the years since 1973 in which the S&P 500 rose during January, the index proceeded over the next 11 months to gain an average of 11.2%. That compares to an average February-through-December gain of just 0.2% in those years in which—like this year—the market fell during January.
Mark Hulbert of the Hulbert Financial Digest points out that there is a big difference between statistical significance and “investment significance.” He notes that a follower of the January Indicator in 2009 and 2010 would have missed out on two years of double-digit gains if one were to have used the occasion of a “down” January to get out of the market.
A far lesser-known seasonal benchmark is the Easter Indicator, which one might say gives the market a second chance after a down January. Analysis by Forbes of this data shows that for the past 30 years, when the S&P 500 is down at Easter, the index averages a loss of 2% for the rest of the year and is positive just half of the time. Years when the index is positive through Easter average a return of nearly 10% for the rest of the year and have been positive an impressive 90% of the time.
S&P 500 returns rest of year after Easter
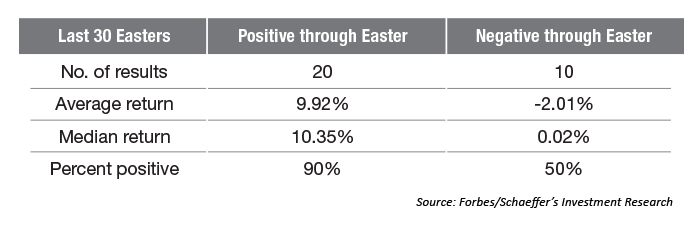
The good news here is that the S&P 500 rallied hard in the shortened trading week before Easter this year, turning what was looking like a negative performance for the year into one ever-so-slightly positive: 0.8% for the SPX.
OK, but what about perhaps one of the most famous Wall Street adages, “Sell in May and go away”? With two different results from January and Easter indicators, a long list of international and domestic worry points, and recent new record market highs, should investors be concerned as May comes to a close?
The “sell in May” argument has been sliced and diced countless ways and over myriad time frames. The simple fact remains that May-October is historically a weaker period than November-April, but that is not a ringing endorsement of using it as a basis for an investment strategy.
Barron’s has pointed out that stocks have been up two-thirds of the time from May-October since 1950, though average returns are worse than any other six-month period. The Stock Trader’s Almanac states that since 1950, the Dow Jones Industrial Average has had an average return of only 0.3% during the May-October period, compared with an average gain of 7.5% during the November-April period.
But if one followed the trend above as an investment thesis, is it worth missing out on years such as 2013, when the S&P was up 10% from May-October?
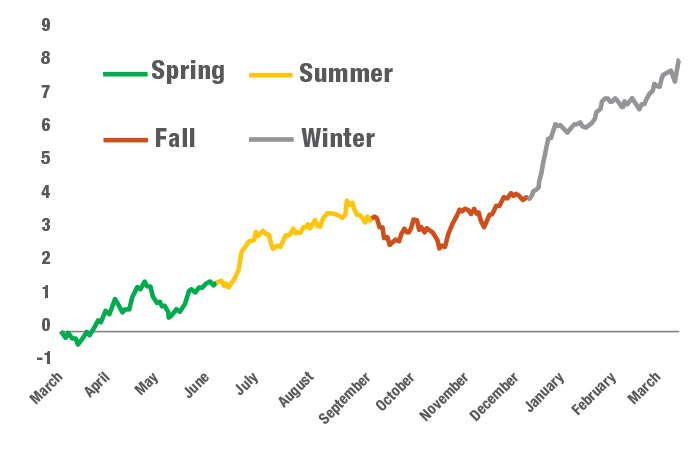
Bespoke Investment Group, which provides exhaustive and expert statistical analysis, recently published a chart (A) examining the historical returns of the S&P 500 by season of the year. This broadly supports the Almanac data cited above, with a hard-to-miss strong uptrend through the winter and early spring months. Bespoke, however, is quick to point out that there are no guarantees with historical patterns, and they have seen subtle shifts in seasonal trends over the past 20 years.
Chart A: Seasonal Composites—S&P 500 Cumulative Returns (%)
March 1928 to Present
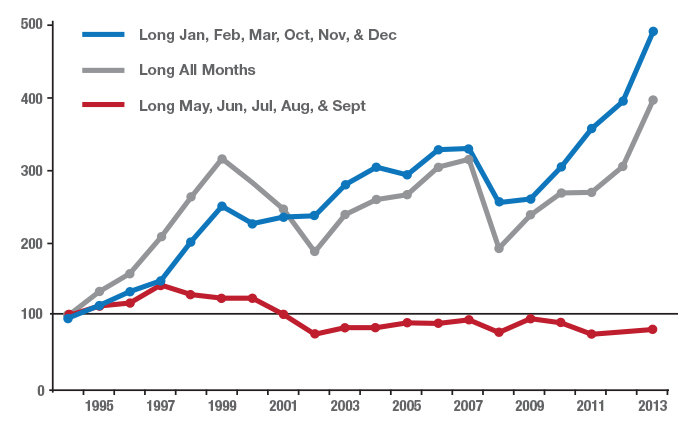
FBN Securities took this one step further, developing an intriguing chart (B) that shows the impact of an investment strategy that cherry-picks certain months of the year.
Chart B: S&P 500 P&L Line—Sell in May Performance
Can we gain further clues as to this year’s performance with a quick look at presidential cycles, which are closely followed by many analysts?
Again, yes and no, as the second terms of presidents generally lead to rocky markets (particularly in the second and third quarters) and have historically been the weakest of the four-year presidential cycle. However, sixth years of presidential terms have a median gain of 14.6% since 1961, although the sample is admittedly limited. Which will it be this time?
There is further good news, however, regarding 2014’s seasonality outlook from an examination of a variety of respected research sources. While most cyclical models are “predicting” some very choppy market action through October, consensus has the fourth quarter of 2014 again turning much more favorable, powered by what has now become in recent years the traditional year-end rally and expected improvements in economic data. In fact, the fourth quarter of midterm election years has historically been one of the strongest quarters of the entire presidential/election cycle.
But does any of this matter, as there are plenty of exceptions to disprove each and every rule? And do seasonality cycles matter in the face of broader market cycles? For example, the current bull market has now extended to just over five years. While secular bullish trends can indeed last 10-15 years, the average bull market runs for about 4-6 years. Even within the longer-term bullish periods, corrections of 10%-20% can generally be expected.
No matter the strengths of any predictive methodology based on seasonality or analysis of historic patterns, they can never absolutely predict a short- or intermediate-term market outcome. While such analysis is interesting and instructive, it is hardly a reason to abandon sound risk-management practices and constant market vigilance.
The opinions expressed in this article are those of the author and do not necessarily represent the views of Proactive Advisor Magazine. These opinions are presented for educational purposes only.
 David Wismer is editor of Proactive Advisor Magazine. Mr. Wismer has deep experience in the communications field and content/editorial development. He has worked across many financial-services categories, including asset management, banking, insurance, financial media, exchange-traded products, and wealth management.