
Then, nine days later—a catastrophic trigger event. The onset of Armageddon, thought many traders, had begun. Most oil paintings will not dry in nine days—but that was the time it took to go from manic to depressed. Eleven days after the closing bottom of Feb. 8 and the “abyss” low of Feb. 9, the “market” could hardly remember what happened since the day the Olympics hit the airwaves.
This was an event I had to check out historically. I looked at the same parameters, using closing data: I checked how many times the S&P 500 has fallen more than 10% in nine days (trigger date) and then retraced 66% from the bottom of the trigger event within 11 days (end of trigger period). It does not happen often, and there are some periods that were close.
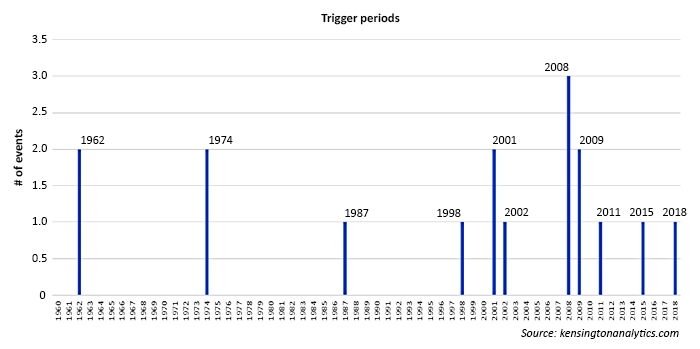
First, it is rare to have a -10% trigger event happen within nine trading days. This has happened 16 times since 1960. What is even rarer is a 50%-plus retracement from the trough within 11 days. This has happened eight times. So, eight such trigger events in a 13,995-trading day history. What is also interesting is that a drop of this magnitude or greater within nine days happened only twice in the 1960s, twice in the 1970s, once in the 1980s, once in the 1990s, and 10 times in the 2000s.
Next, I examined what the 100- and 200-trading-day returns and deepest drawdown were after each trigger event. I was surprised to find out that whether the retracement was successful or not 11 days after the trigger event, the 100-day average return was 5.94%, with an average deepest drawdown of -11.27%. The 200-day average return was 17.15%, with an average deepest drawdown of -12.64%.
Note that most of the drawdown occurred during the data points between the crash of 1987 and 2008, which skews the average tremendously. So, I looked at the eight events where the retracement had completed itself within 11 days, and the scenario changed radically. The 100-day average return increased to 11.28%, with an average deepest drawdown of -7.42%. The 200-day average return increased to 20.1%, with an average deepest drawdown of -7.84%. Also, the only period that produced a negative return after the trigger point was after the 9/11 tragedy, on Sept. 17, 2001.
Given these stats, February’s trigger event was rare. It was made even rarer when you consider that 1962, 2008, and 2009 had multiple trigger points that were clustered close together. There have been a couple of “successful” retracements that were within a cluster of trigger periods that proved to be unsuccessful market calls. Overall, this event was a very unusual market point in time. The market became overstressed in a fast, condensed fashion, and then it made a rapid V-shaped recovery—though not all of the way back to the starting point.
Also, the fact that this type of trigger event has happened 10 times in the last 18 years—versus only six times in the previous 42 years—raises eyebrows. My personal bias about this trend for a greater number of such events is the changing of the market structure as a whole—with the introduction of, among other things, expanding dark pools; high-frequency trading patterns that “break” during market stress; and the effects on ETFs, which hold a tremendous amount of securities. Frankly, I believe the true definition of “market” has not applied to this market for over a decade.
Thus, as active managers, it is valuable to know some of the historical backdrop of the recent weeks. The bottom line is always to manage carefully in times of market distress. I hope this small, quirky analysis proves valuable as you think about the trigger event of February 2018 and what the historical aftermath probabilities look like.
NUMBER OF TRIGGER EVENTS PER YEAR SINCE 1960

The opinions expressed in this article are those of the author and do not necessarily represent the views of Proactive Advisor Magazine. These opinions are presented for educational purposes only.
 Ian Naismith is a partner and the index designer of Smooth Sailing Indexes Inc., which is a leader in tactical “risk-on/risk-off” index development. Mr. Naismith has been analyzing and trading the markets since the early 1990s. He is a member of the National Association of Active Investment Managers (NAAIM) and has also served as board member and president. www.smoothsailingindexes.com
