Many traders recognize the influence that the Fed and its policies have on the stock market. Fed member press conferences are highly watched and scrutinized as traders look to interpret snippets and reposition their portfolios to take advantage of potential changes in Fed policy. Such language interpretation and policy anticipation is difficult to profit from since market reactions are often swift and volatile. But exploitable edges do exist if traders understand the historical market tendencies that are prevalent on and around Fed announcements.
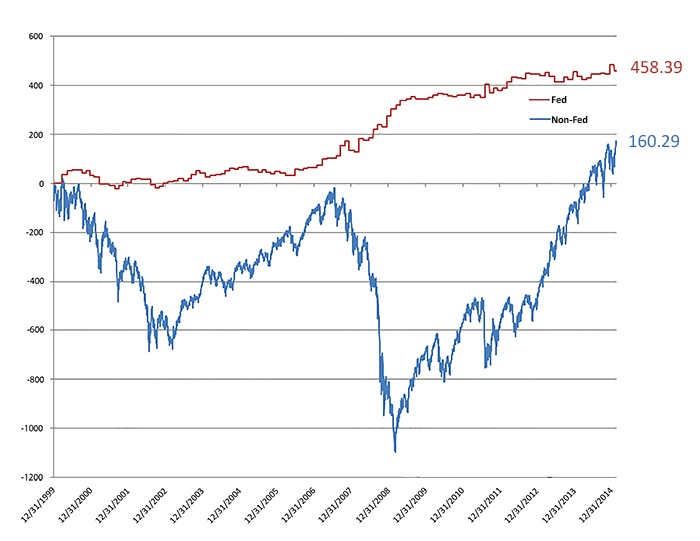
The days that offer the most reliable and powerful edges with regards to the Fed are the eight days each year that mark the final day of each scheduled Fed meeting and commence with a policy announcement, normally around 2 p.m. EST. I refer to these as “Fed Days.” The overall bullish tendency found on these days can be seen in the following chart, which compares all Fed Days since 2000 versus any day over that time that has not been a Fed Day.
The 121 Fed Days have gained 458.39 points while all other days have managed just 160.29 SPX points over the same 15-year period. And Fed Days have managed to realize those gains with very little drawdown. And if we look at some simple filters, you’ll see that the bullish Fed Day edge is much more pronounced with certain conditions in place.
Generally, the Fed strives to create an economic environment conducive to long-term growth. In times of strife, it will look to stimulate the economy, and it may offer soothing language in its announcement. But when the economy is in danger of getting overheated, the Fed will tighten and pull in the reins a bit. So the same message of hope is often not seen when times are good. A simple filter that demonstrates this concept is a 20-day closing high.
SPX points gained on Fed Days vs. Non-Fed Days 12/31/99-2/19/15

Source: QuantifiableEdges.com
Since 2000 there have been 21 Fed Days when SPX closed at a 20-day high the day before. Ten resulted in positive Fed Days and 11 saw negative Fed Days. Overall, SPX lost 36.43 points over these 21 Fed Days. This means that instances where the SPX did not close at a 20-day high the day before saw 59 of 100 Fed Days rise for a total point gain of 494.82 points.
Another filter I often look to is how the day before the Fed Day closed. Fed Days have shown a bullish inclination as far back as 1982, so this tendency is known by many traders. This leaves front-running a possibility. By looking at where the market closed within its daily range the day before a Fed Day, we can see whether front-running has likely occurred. For this study, I used SPY instead of the SPX cash index, because daily ranges were more accurate. I found that there were 73 instances where SPY closed in the top half of its daily range the day before. The average Fed Day when this happened saw a gain of 0.25%. But when SPY closed in the bottom half of its daily range the average gain on those 48 instances was nearly double, at 0.48%.
Fed Days have long provided a quantifiable edge. And though they only comprise a small portion of trading days, behavior on and around Fed Days offers substantial trading opportunities that are not found for much of the year. Simple filters like the ones shown above can be used to further evaluate the potential. As traders, when such strong edges are apparent, it is often advisable to find ways in which to exploit them.
The opinions expressed in this article are those of the author and do not necessarily represent the views of Proactive Advisor Magazine. These opinions are presented for educational purposes only.
 Rob Hanna has worked in the investment industry since 2001. He is the founder and publisher of Quantifiable Edges, a quant-based website where he also publishes a newsletter. After managing a private investment fund through Hanna Capital Management LLC from 2001 to 2019, Rob joined Capital Advisors 360, where he now serves as a registered investment advisor and focuses on short-term and quantitative strategies. quantifiableedges.com
Recent Posts:
