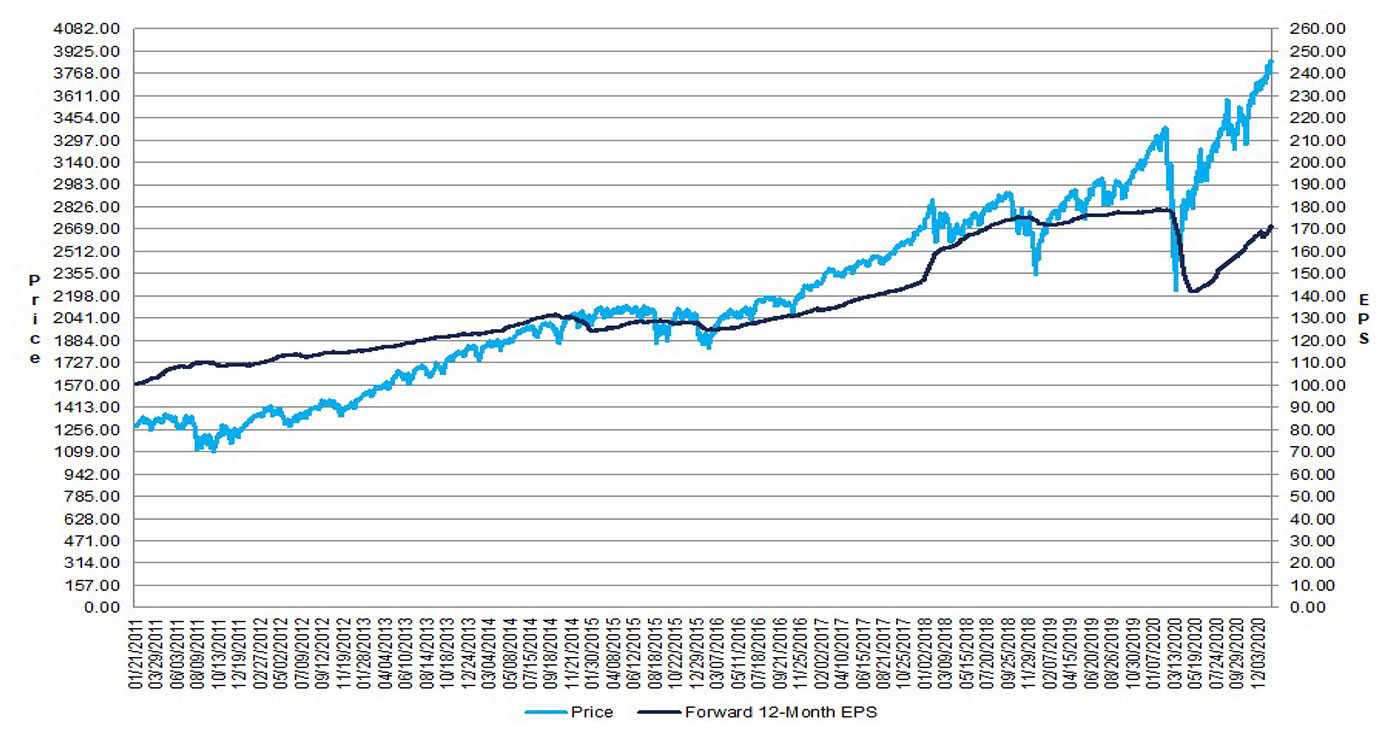
As the Q4 2020 earnings season kicks into high gear this week, analysts are noting the impressive results so far.
Yahoo Finance reported on Monday, “It’s early days in the Q4 earnings season, with about 13% of the S&P 500 having reported results through Friday. But so far, companies are blowing away expectations by historic margins.”
As part of its reporting, Yahoo Finance says the financial sector has driven the very positive early earnings data:
“Most of the beats are so far being driven by the big banks like JPMorgan (JPM) and Goldman Sachs (GS), which reported blowout numbers last week. ‘Thus far, 59% of the earnings announced are Financials,’ Credit Suisse’s Jonathan Golub wrote on Friday. ‘This group has surpassed expectations by 30% while the rest of the companies that have reported have delivered an aggregate beat of 15%.’ … ‘Our Global Equity strategists believe that consensus earnings expectations are too conservative for Q4 results,’ JPMorgan’s John Normand said on Friday. …
“Analysts do expect, however, that Q4 earnings will reflect a year-over-year decline, led by sharp drops in the energy and industrials sectors. Seen this way, Q4 earnings might also be described as ‘better than feared’ rather than ‘better than expected.’”
FactSet presented the following Q4 earnings season key metrics as of Friday, Jan. 22:
- “Earnings Scorecard: For Q4 2020 (with 13% of the companies in the S&P 500 reporting actual results), 86% of S&P 500 companies have reported a positive EPS surprise and 82% have reported a positive revenue surprise. If 86% is the final percentage, it will tie the mark for the highest percentage of S&P 500 companies reporting a positive EPS surprise since FactSet began tracking this metric in 2008.
- “Earnings Growth: For Q4 2020, the blended earnings decline for the S&P 500 is -4.7%. If -4.7% is the actual decline for the quarter, it will mark the fourth straight quarter in which the index has reported a year-over-year decline in earnings.
- “Earnings Revisions: On December 31, the estimated earnings decline for Q4 2020 was -9.2%. Nine sectors have smaller earnings declines or higher earnings growth rates today (compared to December 31) due to positive EPS surprises.
- “Earnings Guidance: For Q1 2021, 2 S&P 500 companies have issued negative EPS guidance and 9 S&P 500 companies have issued positive EPS guidance.
- “Valuation: The forward 12-month P/E ratio for the S&P 500 is 22.5. This P/E ratio is above the 5-year average (17.6) and above the 10-year average (15.7).”

Source: FactSet
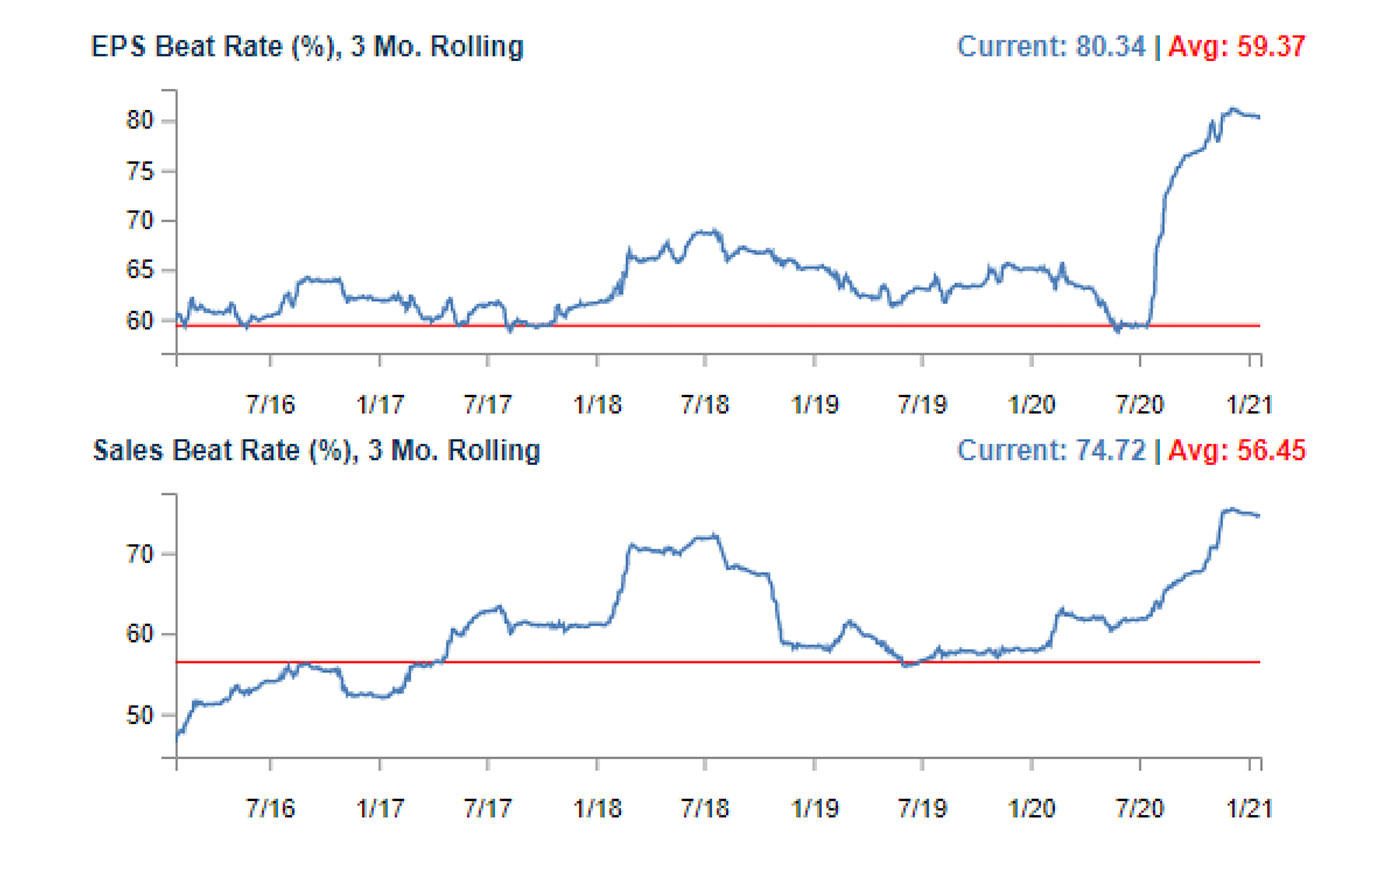
Bespoke Investment Group says that companies exceeding EPS estimates at a significant rate is essentially an acceleration of trends seen throughout 2020:
“Even with Wall Street analysts increasing their EPS estimates in the month leading up to the last three earnings seasons, companies have managed to beat those estimates in record numbers as evidenced by our ‘beat rate’ tracker … [Figure 2].
“The current earnings season has so far produced similarly strong earnings results. Of the 15 largest companies (by revenues) that have reported so far this quarter, all but one has topped EPS estimates. The one company that missed EPS was Netflix, which rallied 16.9% in reaction to its report because of enormous subscriber numbers and guidance.”

Source: Bespoke Investment Group
“Earnings and guidance are ultimately what drive equity prices higher or lower. Positive analyst expectations and extremely strong forward projections from companies themselves have set the bar very high. Given massive runs higher in share prices for a large portion of the market, stocks currently have a lot to live up to. When expectations are high, any hiccups can be disastrous. …
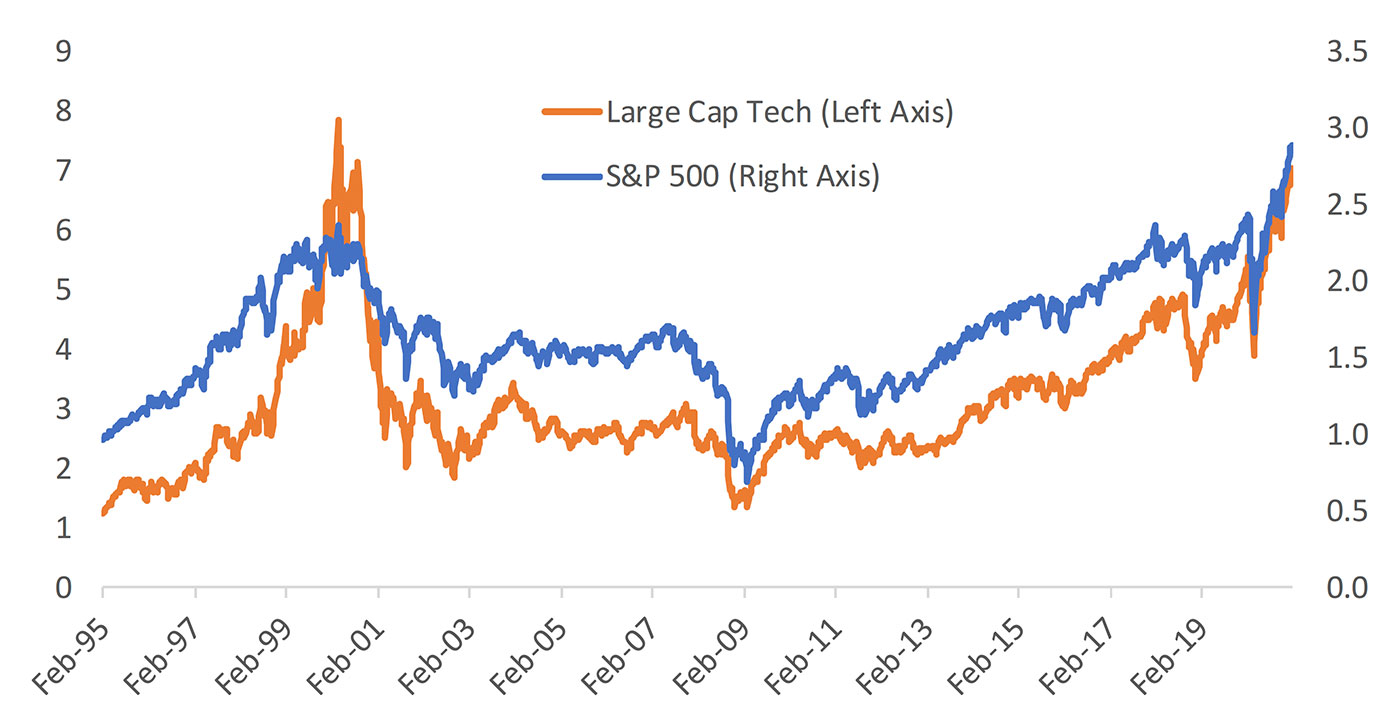
“While Corporate America and the economy look much different (and healthier) now than [they] did in the late 90s, elevated valuations similar to what we saw then cannot be ignored. As shown [Figure 3], the price to sales ratio for the S&P500 is higher now than the peak in early 2000, and the Tech sector’s price to sales is almost as high.”

Source: Bespoke Investment Group
