
Editor’s note: Tony Dwyer, U.S. portfolio strategist for Canaccord Genuity, and his colleagues author a widely respected monthly overview of economic and market conditions, technical factors, and future market outlook called the “Strategy Picture Book.” The following provides an excerpt from their April 4, 2022, report.
We want to clarify why the yield curve (YC) is a recession indicator, and which one we think should be used.
First, it is important to remember why the yield curve is such a good indicator of recession. The yield curve measures the spread between what a lending institution pays for its money versus what it can make by lending or investing it. When short-term rates are higher than long-term rates (inversion), it severely disincentivizes lending, thereby restricting the supply of money.
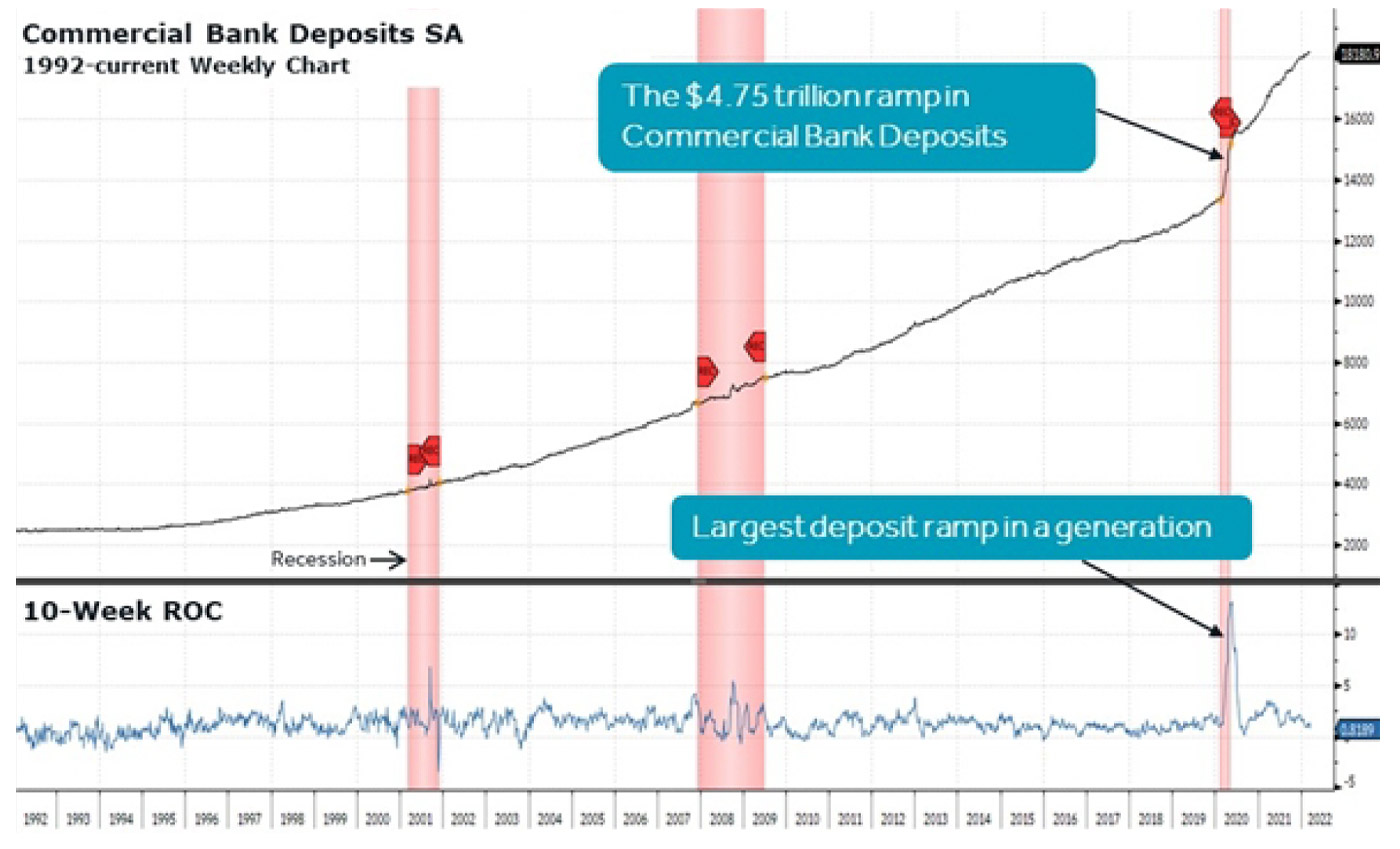
Although the two-year/10-year YC is very popular, we currently favor the three-month/five-year YC because of the historic level of money put into depository institutions (Figure 1). According to Bloomberg’s Fed data, commercial bank deposits surged by $4.75 trillion to over $18 trillion since February 2020.
FIGURE 1: THE MONETARY AND FISCAL STIMULUS LED TO
A HISTORIC RAMP IN BANK DEPOSITS

Sources: Bloomberg, Canaccord Genuity
Our favored yield curve is not signaling recession
The point is that excess money went into the banking system that pays near zero (deposit rate) but is lent or invested at a much higher rate given the rise in the middle portion of the YC. We believe at this point in the economic cycle, the proper YC given the historic surge in deposits is the difference between the three-month (cost to banks) and the five-year U.S. Treasury yield (near where they lend it). It is important to note that even if you use the two-year/10-year YC, the history over the last eight cycles suggests the recession and SPX both peak 18 months after the initial inversion—with a 17.69% median SPX gain.
Using near-term risk as intermediate-term opportunity—and where we would be wrong
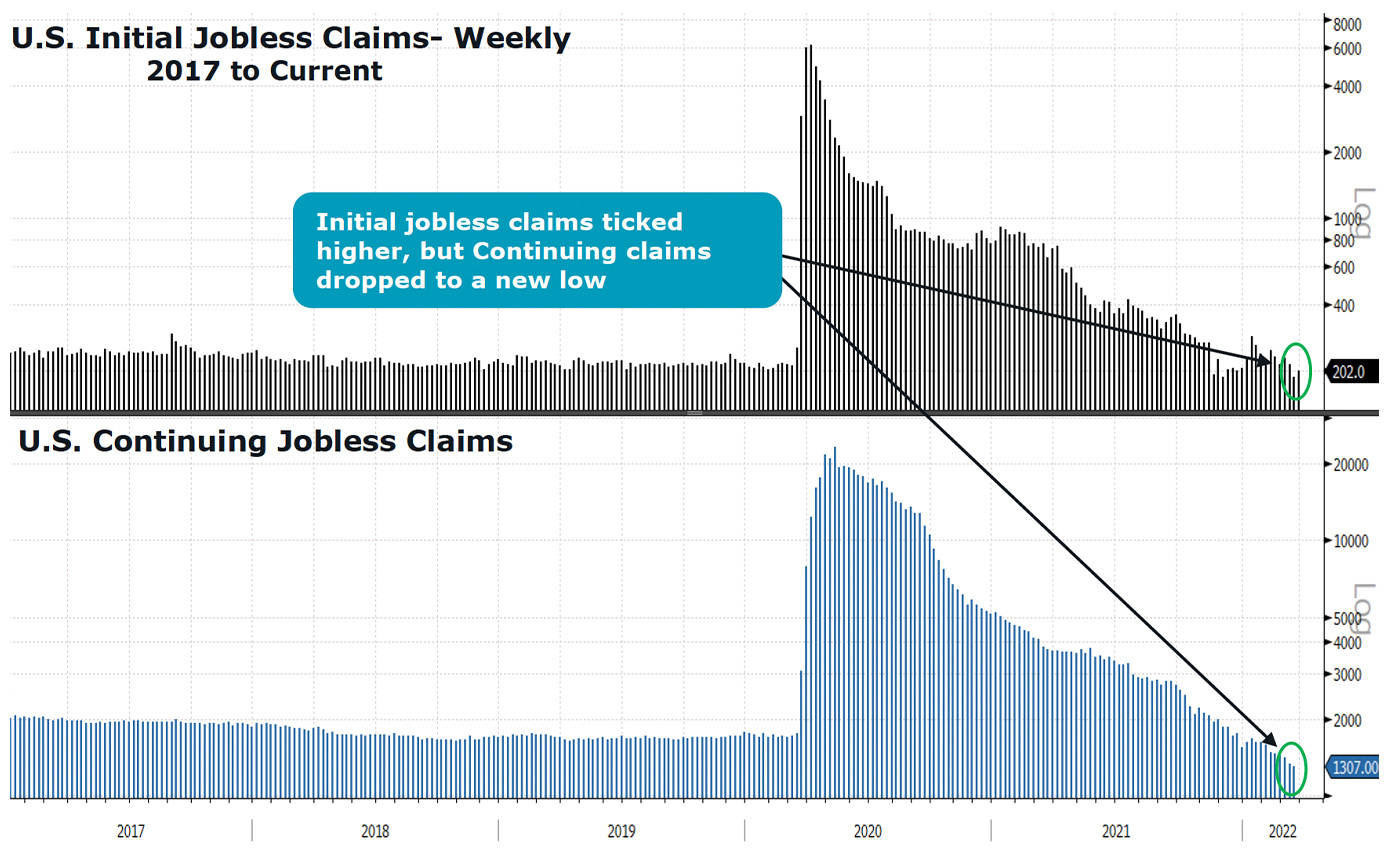
Our fundamental core thesis continues to point to positive economic growth driven by continued liquidity and a transition from goods to services as the economy fully reopens from the pandemic.
FIGURE 2: ECONOMIC OUTLOOK—GDP GROWTH SUPPORTED BY LABOR IMPROVEMENT

Sources: Bloomberg, Canaccord Genuity
Investors will be wrong with a more optimistic outlook if the economy falls into recession. Clearly, inflation, higher interest rates, the Russian invasion of Ukraine, and the economic transition from goods to services spending could have a dampening impact on growth, but ultimately growth should remain positive.
We expect to experience further market volatility. But the significant decline in equities in early March, the intermediate-term oversold condition, and the history following such strong four-day rallies following an intermediate-term market low suggest using further bouts of weakness as an opportunity to add exposure—rather than something to fear.
The opinions expressed in this article are those of the author and do not necessarily represent the views of Proactive Advisor Magazine. These opinions are presented for educational purposes only.
New this week:
 Tony Dwyer is the head of the U.S. Macro Group and chief market strategist at Canaccord Genuity. He also sits on the firm’s U.S. operating committee. Mr. Dwyer joined Canaccord Genuity in 2012 and is known for the practical application of macroeconomic and tactical market indicators. Mr. Dwyer was previously equity strategist and director of research at Collins Stewart and a member of the firm's executive committee. Mr. Dwyer is a frequent guest on many financial news networks. canaccordgenuity.com
