


What can we look at now? How about the S&P 500—and the fact that it has gone 29 consecutive weeks without dipping below its highs by more than 4%? This market streak started during the week of the U.S. presidential election and has been cranking ever since. What caught my attention is that I could not remember how many times in my career (starting in 1992) when volatility and drawdown were so tame.
It turns out that this recent period of steady returns, which began the week ending 11/4/2016, represents only one of seven events of its kind since 1960. Yes, one of seven. So, I reviewed other periods when the S&P went at least 29 weeks without a 4% or more retreat from its highs. The result is the following table, which highlights the rarity of this event.
TABLE 1: HISTORICAL ‘STREAKS’ OF THE S&P 500 WITHOUT A 4% CORRECTION (PRICE ONLY)
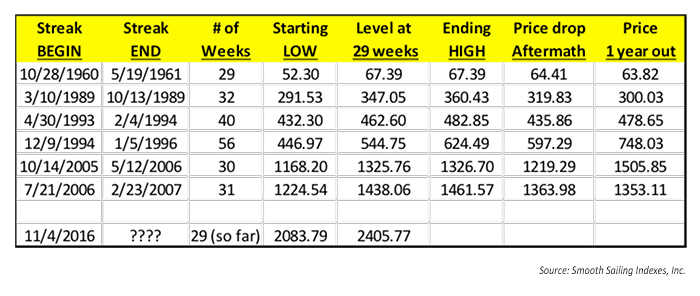
Notice, first, how darned good the S&P 500 has done in the past 56 years. But along the way, there have been hundreds of 4% or greater retreats from attained highs. Streak lengths vary wildly during different markets, but very few last beyond 15 weeks without a 4% correction. Therefore, it is rather safe to conclude that this current rally will begin to top, then retreat. As you can see, four of the seven streaks came to an end from 29 to 32 weeks. The era of “easy money with little pain” that occurred mid-1993 through early 1996 happened within a market streak we have not seen since. Thus, I am approaching the next six to 12 weeks with caution—and have created the “price drop aftermath” column for both measurement and emphasis.
The next table expresses the rates of return from varying entry and exit points. The “streak low” represents the bottom from which each streak began, and the “streak high” represents where the streak ended (measured at the end of the week).
TABLE 2: RETURN AT 29 WEEKS VS. FINAL STREAK HIGH
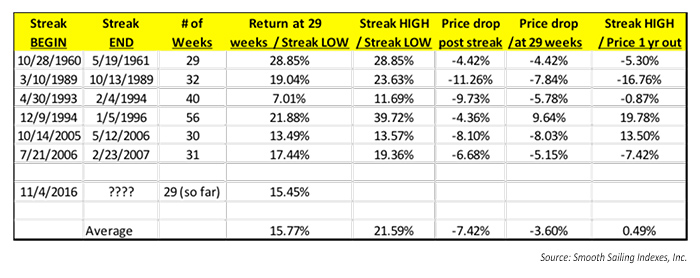
As you can see, compared to historically similar events, we are currently near the middle with the current streak returns. Looking at historical averages, a price drop of 7% after the streak is over would not be out of line.
But, when is “over”?
I compared where we are in this 29th week to returns in the 29th week for the other streak periods (removing the streak ending in 29 weeks in 1960–1961). What I found was, regardless of the length of the total streak, the market ran between nil and almost +18% past the 29th week, averaging almost a full 6% return. Removing the 12/9/1994 to 1/5/1996 outlier, the return past the 29th week shrinks to 2.8%. Interestingly, the price drop that followed the end of the streak was almost always below the level at the 29th week, with the exception of the same outlier.
What does this mean? Only once in history, if an investor were to sell and lock in gains at the end of the 29th week, that investor would have a greater return than betting on the market streak continuing and selling at the next low point (or beginning of the next streak) that occurs after the current streak’s high point.
The opinions expressed in this article are those of the author and do not necessarily represent the views of Proactive Advisor Magazine. These opinions are presented for educational purposes only.
 Ian Naismith is a partner and the index designer of Smooth Sailing Indexes Inc., which is a leader in tactical “risk-on/risk-off” index development. Mr. Naismith has been analyzing and trading the markets since the early 1990s. He is a member of the National Association of Active Investment Managers (NAAIM) and has also served as board member and president. www.smoothsailingindexes.com