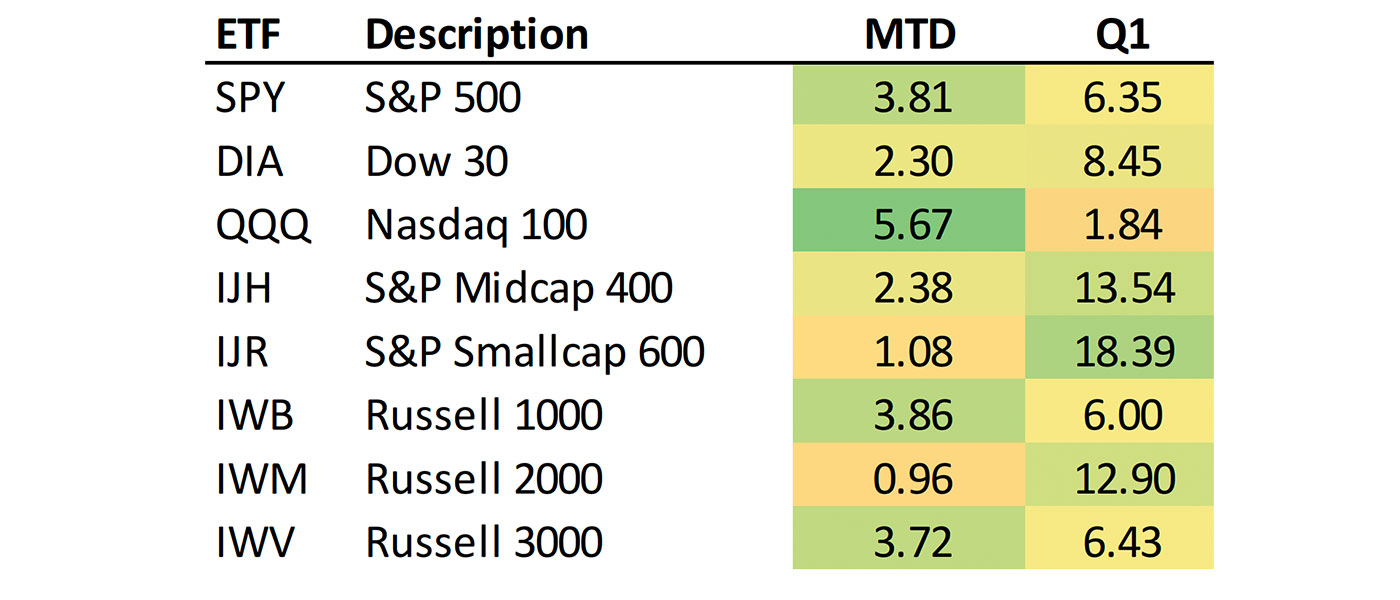
While the NASDAQ 100 lagged other major indexes in the first quarter of 2021, it has outperformed to start the second.

Source: Bespoke Investment Group, data through 4/8/2021
Bespoke Investment Group pointed out this past weekend,
“For major US indices and sectors, Q2 has been nearly a complete reversal of performance during Q1 as indices and sectors that led in Q1 have generally lagged in the opening days of April. …
“While the second quarter is barely a week old, we have already started to see some noticeable rotation back into sectors like Tech and Consumer Discretionary as momentum has regained favor over growth.
“Some of that is evident when checking in on the themes that have driven performance through the first five days of the second quarter (performance through Thursday’s close). Some clear outperformance has come from the stocks that were the worst performers in Q1, had the highest valuations, highest price, and most optimistic analyst outlooks. … The decile of the worst performing stocks in Q1 averaged a decline of 9%, but since Q2 began those same stocks which includes mega-cap names like Tesla (TSLA), Apple (AAPL), and Amazon (AMZN) have been the top performers averaging a 2.91% gain.”
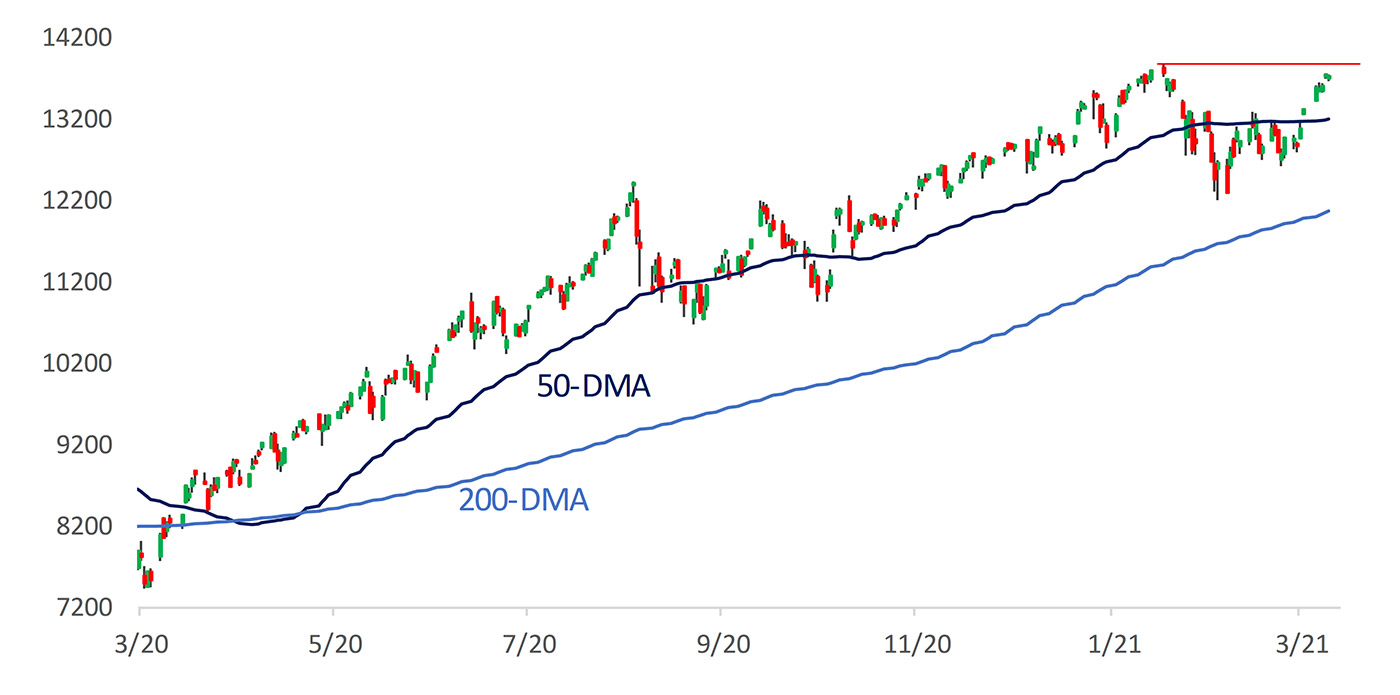
In early March, the NASDAQ 100 was down about 12% from its most recent all-time high, but it has since rallied higher by approximately 13%. It is now approaching that prior high and attempting to break out of its current trading range.
FIGURE 1: NASDAQ 100 (LAST 12 MONTHS)

Source: Bespoke Investment Group, data through 4/8/2021
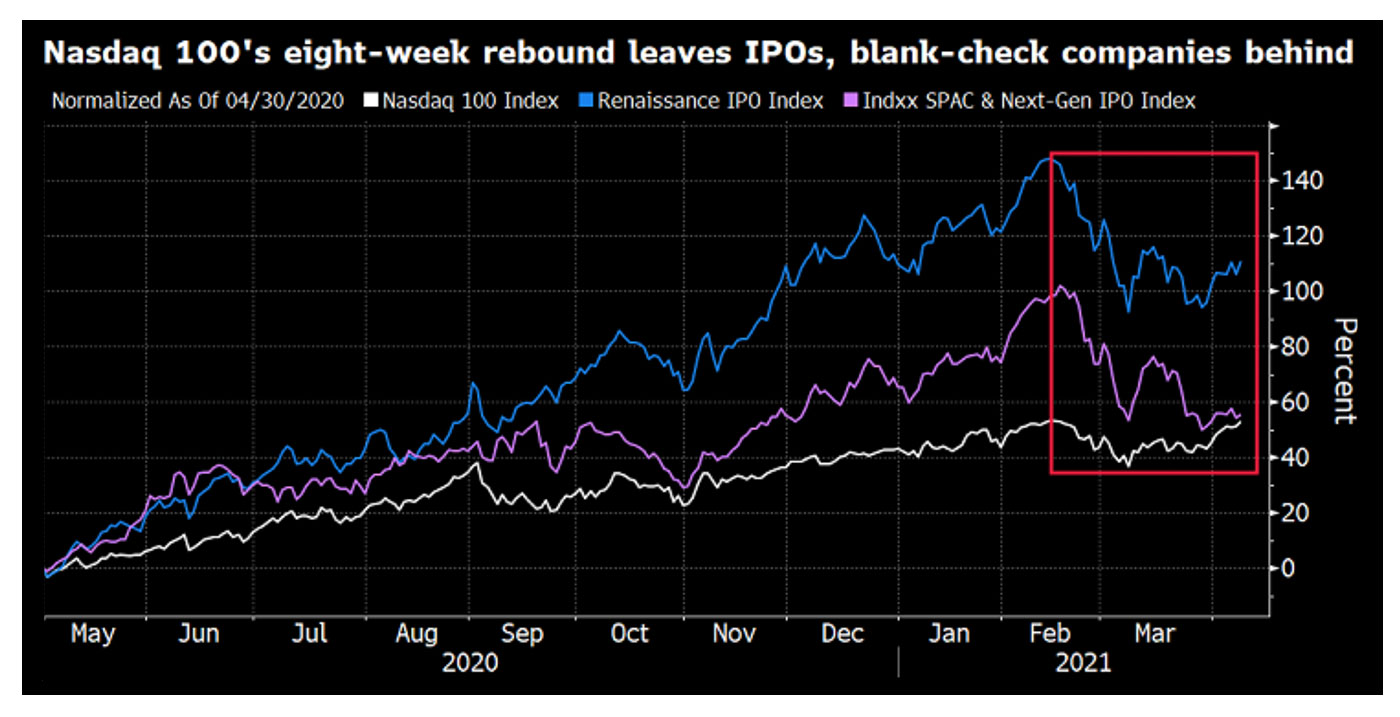
Bloomberg analyst David Wilson points out that the NASDAQ 100’s recent rally has not included relatively recent IPOs or special purpose acquisition companies (SPACs):
“Nasdaq’s biggest companies are close to completing an eight-week reversal that newly public U.S. companies can only wish for. The Nasdaq 100 Index’s close Thursday was just 0.4% away from a record set on Feb. 12.
“Initial public offerings have been left behind, as the Renaissance IPO Index trailed its Feb. 12 record by 15%. So have special purpose acquisition companies, as the Indxx SPAC & NextGen IPO Index was down 23% from a high on Feb. 16. SPACs were ‘the one area of excess to show no sign of recovery at quarter end,’ Michael Shaoul, Marketfield Asset Management LLC’s chief executive officer, wrote Thursday [4/8] in a report comparing the three indexes.”
FIGURE 2: RELATIVE PERFORMANCE OF NASDAQ 100 VS. IPO AND SPAC INDEXES

Source: Bloomberg.
Based on analyst projections, FactSet is forecasting a 24.5% year-over-year increase in S&P 500 earnings for the first quarter of 2021. This is significantly higher than the outlook at the end of December 2020, where the estimate was for a 15.8% increase.
In terms of revenue growth for the Q1 earnings season, the sectors projected to have the highest year-over-year increases are Information Technology, Consumer Discretionary, and Communication Services. That may bode well for a further price advance for the NASDAQ 100.
