


When it comes to predicting market movement, an endless number of market indicators are out there. And they are based on an ever-growing number of ideas. The most common market indicators are based on things like price action, volume, breadth, sentiment, government policy, or cross-market analysis. But people might also look at sunspots, moon cycles, weather, or any number of things where they find a correlation to market movements. No matter what indicators a trader favors, it does not take long to realize that none of them work perfectly. And even if you find one that is incredibly reliable, it may not be providing strong readings often enough to generate consistent returns. Therefore, every trader I know looks at more than one input or indicator to try to find an edge.
Of course, the more market indicators you use the more likely it is that some of them disagree. It is rare that a trader will see all of their indicators line up perfectly at the same time. Often price action may be suggesting one thing while breadth, or sentiment, or intermarket action may be suggesting something else. Traders need to determine whether the mix of evidence is suggesting a bullish or bearish indication, and how strong that indication is.
At Quantifiable Edges, I use market indicators in a slightly different way. Rather than simply interpret readings or patterns that I am seeing, I generate market research studies to understand how similar situations have performed historically. These studies, published in the Quantifiable Edges Subscriber Letter, help me establish my market bias. But like other traders’ market indicators, my studies don’t always agree. The tool I use to help me weight my studies and determine a market bias is one that I call the “Aggregator.” A chart with the Aggregator included can be seen below. It shows readings from December 2017 into January 2018.
S&P 500 (SPX) DAILY CHART WITH AGGREGATOR/DIFFERENTIAL TREND
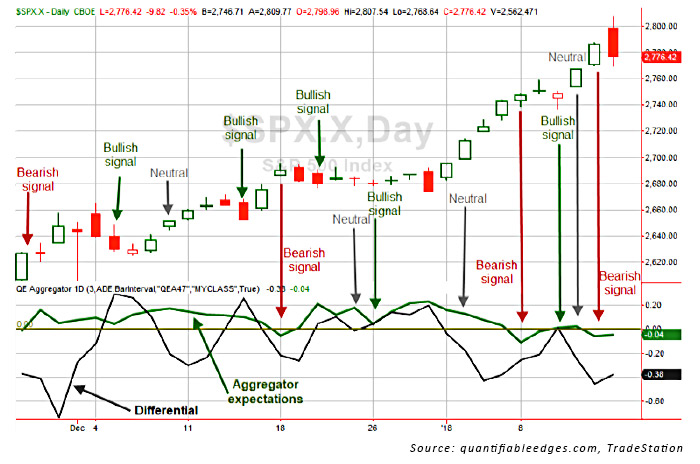
Each day, the Aggregator takes the current studies on the Quantifiable Edges Active List and creates a composite estimate. That estimate, represented by the green line, looks out over the next few days. If the green line is above zero, then estimates are looking for the market to rise over the next few days. When it is below zero, then estimates are anticipating a decline.
The black line in the chart is what I refer to as the “Differential.” It shows the difference between recent Aggregator estimates and actual market movement, and it provides our own overbought/oversold indication. When it is above zero, that implies the market has failed to meet recent expectations of the Aggregator and could be considered oversold. When it is below zero, that means the market has exceeded recent expectations and could be considered overbought. (Note: The market can have one or more negative days and still be overbought, according to this reading, and it can have one or more positive days and be oversold.)
Combining expectations with overbought/oversold means there are four possible formations on the chart:
1. Both lines above zero.
2. Both lines below zero.
3. The Aggregator expectation line is above zero, and the Differential line is below zero.
4. The Aggregator expectation line is below zero, and the Differential line is above zero.
Formation 1—I generally consider this to be a bullish setup. Oversold with bullish expectations is often a good place to buy.
Formation 2—I generally consider this to be bearish. Overbought with bearish expectations can mean a good shorting opportunity.
Formations 3 and 4—I generally consider these to be neutral. Positive expectations in an overbought market often don’t offer great risk-reward. And neither do negative expectations and an oversold market. I will not normally be looking to take on new index positions when the Aggregator is in formation 3 or 4. However, both of these formations still provide valuable information. Oversold with negative expectations keeps me from trying to go long a pullback that does not show a high probability of bouncing. And knowing there are positive expectations when the market is overbought helps me to avoid shorting into overbought situations where the historical indications are for further gains.
To help you easily spot where the Aggregator formation has changed to bullish, bearish, or neutral, I have included arrows and signals in the chart. Keep in mind, the signals occur at the end of the day and suggest a bias for the next few days. As you can see, the Aggregator has done a nice job of anticipating short-term market movements.
The bottom line is the studies help me determine whether there is an upside or downside edge. The Differential measurement helps to assess risk-reward. The Aggregator chart combines them and helps me to establish a short-term market bias. It has been an extremely valuable tool for me.
While an Aggregator chart may not be suitable for all traders, I do suggest coming up with a simple weighting system for your favorite market indicators. By applying a weighting system, traders can measure signal strength across their indicators and should be able to establish a market bias more easily and more effectively.
The opinions expressed in this article are those of the author and do not necessarily represent the views of Proactive Advisor Magazine. These opinions are presented for educational purposes only.
 Rob Hanna has worked in the investment industry since 2001. He is the founder and publisher of Quantifiable Edges, a quant-based website where he also publishes a newsletter. After managing a private investment fund through Hanna Capital Management LLC from 2001 to 2019, Rob joined Capital Advisors 360, where he now serves as a registered investment advisor and focuses on short-term and quantitative strategies. QuantifiableEdges.com