The cover story of the October 19, 2015, edition of Barron’s, titled “Look Out, Bears,” was based on the findings of the magazine’s latest Big Money poll of professional investors. Fifty-five percent of the survey respondents called themselves “bullish” or “very bullish” about the market’s prospects through next June.
The consensus of this survey is just one of several bullish forecasts for the U.S. equity market currently circulating throughout Wall Street. The outlook of Lowry Research goes against the grain of this positive take. In recent months we have noted that the market is exhibiting the classic signs of a major top.
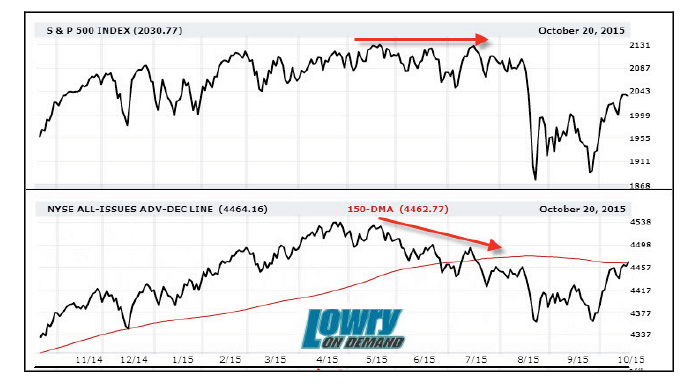
The S&P 500 Index established its bull market high, on both an intraday and closing basis, on May 21, 2015. At that peak, the NYSE All-Issues Advance-Decline Line (A/D Line), a measure of market breadth, or participation in the bull market, failed to reach a new high. This non-confirmation, albeit minor, suggested fewer issues were participating in the advance to the May high than in the advance to the late-April rally high.
The May bull market peak in the S&P 500 was then tested in June and again in July. And, during these tests, more significant deterioration in the A/D Line developed, as can be seen in the chart. This A/D Line weakness is just one of the developments that typically takes place during the formation of a major market top, indicating fewer and fewer issues are participating in rallies in the broad-based price indexes—a clear sign of deterioration in the stock market.
Confirming this signal by the A/D Line, and further reinforcing the erosion in the market that was taking place late in Q2 and into Q3 of this year, was the percentage of S&P 500 stocks down 20% or more from their 52-week highs. At the May market peak, 12% of the S&P 500 index constituents were down 20% or more from their 52-week highs. Then, at the June retest of the high, 15% were down 20%+. Finally, at the July test of the highs, 19% of the index constituents were down 20%+ from their 52-week highs.
The steadily increasing number of issues within the S&P 500 falling into bearish trends, even as the price index was testing its bull market peak, provides a look beneath the surface of the deterioration signaled by the NY All-Issues A/D Line. And, the erosion detailed in the big-cap market segment pales in comparison to the weakness that has gripped the small-cap segment. For example, at the July market peak in the S&P 500, 28.7% of S&P 600 small-cap issues were down 20% or more from their 52-week highs.
Further, Lowry’s proprietary measures of Demand and Supply—Buying Power and Selling Pressure—have exhibited trends in recent months typically seen during the formation of a major market top. Selling Pressure has been trending higher since April, while Buying Power has trended lower. These multi-month trends of rising Supply and falling Demand are patterns that, throughout Lowry’s 88-year history, have occurred consistently during the final stage of a bull market.
As a result, investors should tread carefully with regard to new buying, as the recent recovery rally in the S&P 500 appears to represent a temporary respite in a primary downtrend that still may have many months to run.
S&P 500 VS. NYSE A/D LINE

 Tracy L. Knudsen, CMT, is senior vice president of market research at Lowry Research Corp. She has been a market technician for 20 years and produces analysis of both domestic and international equity markets. A member of the Market Technicians Association (MTA) since 1994, Ms. Knudsen has also served on the board of the American Association of Professional Technical Analysts (AAPTA). She is co-author of “Mastering Market Timing: Using the Works of L.M. Lowry and R.D. Wyckoff to Identify Key Market Turning Points,” published July 2011. lowryresearch.com
